Why Your Sales Rep Turnover is High

How Sales Management Practices Affect Rep Turnover
Turnover is costly. This we know. It’s true that some turnover is necessary and, in fact, can be good for a sales organization. However, too much turnover is usually a sign of major underlying problems.
Every organization battles external, seemingly uncontrollable factors that can impact turnover. These include aggressive recruiting tactics, above-market pay, company culture differences and more. But when it comes to sales personnel, there are a couple of critical internal, quantitative factors that can play a significant role in affecting rep turnover. This post explores these factors and provides a client case study as an example of above-normal turnover and how to address it.
While there are several analyses that aid in understanding high rep turnover, it’s a good idea to begin by looking at rep-level metrics such as quota achievement, territory potential and sales time analysis to explore potential management practices that might contribute to undesired turnover.
To begin, what is the right level of rep turnover? The average annual cross-industry sales rep turnover for B2B sales is 13.9% (this includes voluntary and involuntary). Given the high cost of turnover, best practice organizations aim to manage turnover closer to 8%. Generally speaking, organizations with annual turnover levels lower than 5% or higher than 20% should take a more detailed look at driving factors that may be affecting rep retention.
A recent client of ours had experienced above-market sales growth for several years, but was beginning to lose momentum. While sales rep turnover had been above average for some time, the company’s strong sales growth numbers had been masking its negative effects. With sales growth slowing, the turnover rate was continuing to rise, approaching 25%. Something had to be done – left unchecked, this turnover rate was going to “gut” the sales force.
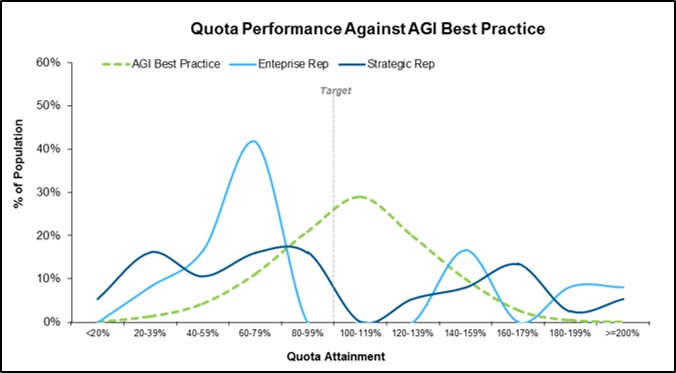
Working with the client, we conducted a “deep dive” into their current methods for setting territories and quotas and compensating reps. The results were surprising, and revealed how these practices contributed to the above average turnover figure. As the first chart shows, analysis of sales compensation data indicated a “bimodal” distribution of quota attainment, where nearly one-fifth of all reps were achieving greater than 150% of quota and just under half of all reps were failing to achieve even 50% of quota.
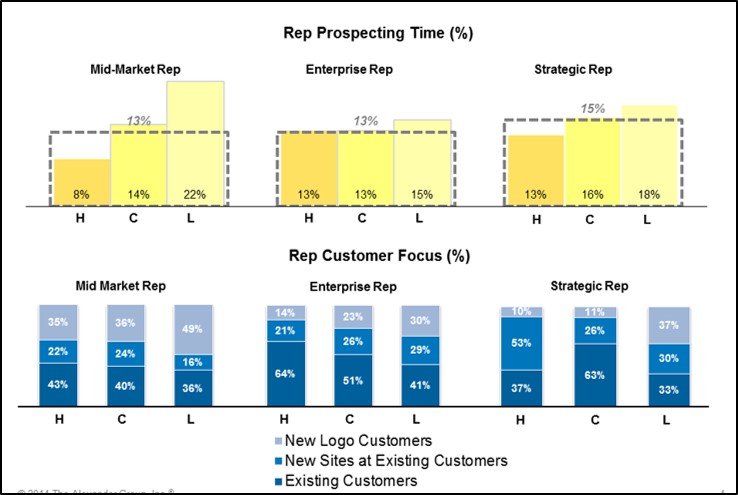
The bimodal achievement guided a more detailed look at how the client set territories and quotas. We measured historical revenue and estimated sales potential across their territories and found that they were unbalanced. An examination of sales rep time across different activities confirmed the territories were out of balance: there was significant variation in time spent prospecting between high, core and low performing reps (high performers were defined as the top 20% in terms of quota attainment, and low performers as the bottom 20%). While high performers were leveraging their existing accounts to drive sales and quota attainment, low performers were spending significantly more time prospecting to new accounts (see second chart).
At first, we thought perhaps the low performers couldn’t sell as well, and this was simply a performance-based issue. But while discussing findings with the client, we learned that the low performers were mostly new hires. The tenured hires had been “grandfathered” into some of the best accounts and territories, and low or reasonably achievable quotas. The new hires were given mostly “greenfield” territories with little to no existing revenue. And to ensure that the company could hit its ever-increasing sales plan, these new hires were strapped with bigger quotas.
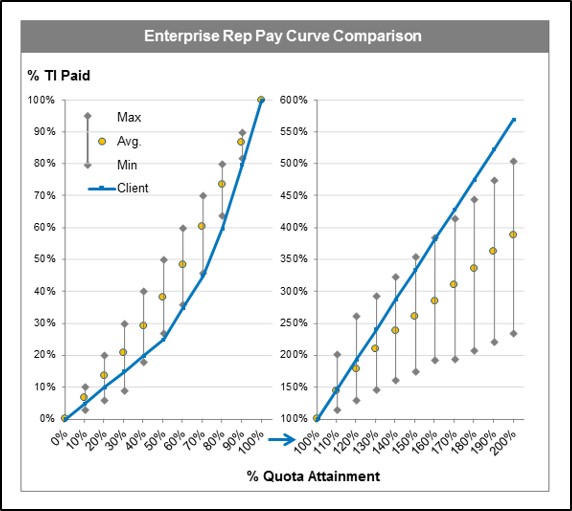
Finally, we worked with the client to review their sales compensation plans. While on-target earnings were slightly above market, the pay mixes were aggressive (low base salaries, high target incentives). Furthermore, the sales plan included an aggressive pay curve that paid handsomely for overachievement, and poorly for below-quota performance. Compared to market practice, this was an aggressive pay curve designed to “starve the turkeys and feed the eagles.” (see third chart)
Taken together, the unbalanced territories, aggressive quotas and aggressive pay plan were attributing to high sales rep turnover. New hires, even if they were very talented, could not succeed. The company began to address these issues by redesigning territories and quotas and adjusting the pay curve to be closer to market. As a result, turnover gradually came back down to the industry norm.
Does your sales force suffer from above-market turnover? Perhaps you’re feeling the effects of strong external factors, such as aggressive recruiting tactics and above-market pay offered by competitors. Or perhaps you’re suffering from some of the sales management issues highlighted here. While external factors are inevitably tough to control, a strong set of analytical tools can drive your sales management towards stabilizing above-market rep turnover.
To learn more about best practice territory, quota and sales compensation design, please visit Alexander Group’s Commercial Analytics practice.