How to Analyze Your Quota Distributions

Regardless of the type of business you are in or the sales strategy you set forth or how your sales force is currently performing, as the sales leader, you should always analyze your quota distributions at the end of each performance period. And yet, shockingly, this simple exercise often gets overlooked, succumbing to the tyranny of the urgent – next quarter. In a quota seminar I facilitated recently, less than 40 percent of the executives indicated they track and review quota distributions on a regular basis. Yet hidden in last period’s performance data are insights about quota quality that the sales leader needs.
Sales Quota Attainment
Every sales leader should have a routine process for analyzing quota distributions at a granular level (i.e., sub-groups such as geographies, job roles, tenure, products, accounts, or industry verticals) to support an effective quota program. The quota program is critical to driving top line results and managing sales costs.
Support an Effective Quota Program
Big Picture: Normal bell-shaped quota distributions are critical to maintaining a well-motivated and cost effective sales force. Moreover, if attainment distributions are not balanced, undesirable results occur such as: low morale, increased turnover, under- or over-payments of incentives. This results in a general failure to create the desired risk/reward environment. In any given period, typically ~60 percent (and this can vary slightly by industry) of reps should achieve hit plan or greater, and ~40 percent will be below goal.
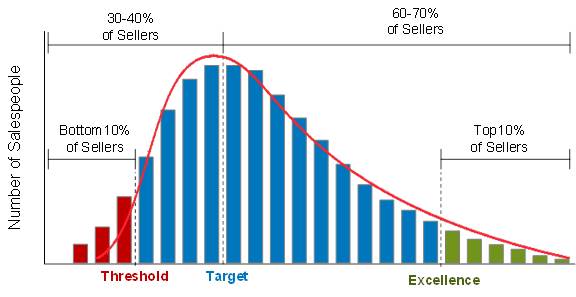
The Smaller (and more interesting) Picture: Frequent review of attainment at the sub-group level ensures consistent quota management across the various subgroups, which helps you to avoid potentially costly mistakes in quota misallocation. Here are 3 examples:
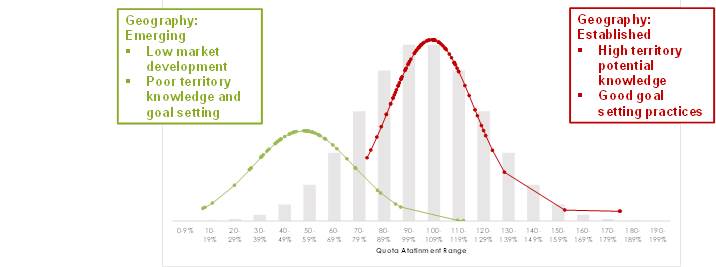
Geography
This is a common and logical first cut. Generally speaking, you should expect similar results across geographies. Factors such as market maturity (e.g., developed vs. emerging), economic growth or stability could impact quota distributions, particularly for a given period. But sustained differences in quota distributions are more often the result of inconsistent practices across geos. It’s far too common (and I suppose, easy) for sales leaders to shrug off these differences based on external factors. But they are often driven by differences in local quota allocation practices, sales crediting practices and rep deployment. The WW Sales Leader ought to examine and discuss these results with their geo leads and ensure consistent practices for quota allocation are followed.
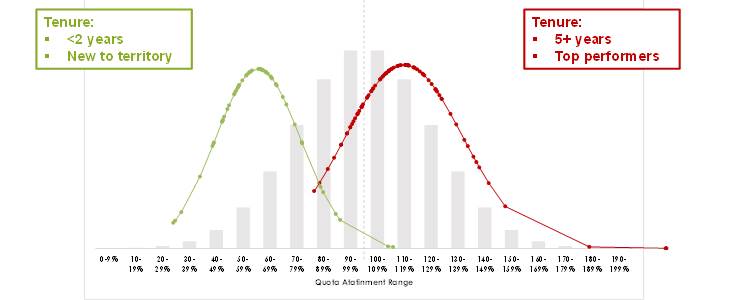
Tenure
Another great but unfortunately far too rare data cut is the breakout of attainment by rep tenure. More tenured reps often have a better chance of exceeding quota. This shouldn’t be the case. While new hires have understandable ramp up times, fully on-boarded new hires should have similar quota distributions as tenured hires. But they often don’t … because of a human problem. Left unchecked and ungoverned, managers tend to allocate less than they should to tenured, strong performers, and more than they should to new hires. The Sales Leader must watch for and mitigate this practice. Good data, as per the example below, sheds light on the situation and drives the right conversation.
Job Role
Hunter, Farmer, Account Manager, Overlay, First Line Manager … Should different job roles have the same quota distributions? Maybe not, but all of these job role distributions should be normal, bell-shaped and centered around the 100 percent attainment mark. The standard deviations may be different. For example, Account Manager (i.e., “farmer”) roles in mature, well-established markets (e.g., office products) will have much smaller standard deviations (customers can only buy so many more paper clips). Meanwhile, Account Executives (i.e., “hunters”) in fast growing new markets (e.g., cloud computing) will have much larger standard deviations. Don’t try to manage the standard deviations – doing so will lead to artificially manipulating pay. Instead, test and manage for displaced, multi-modal and overall skewed results.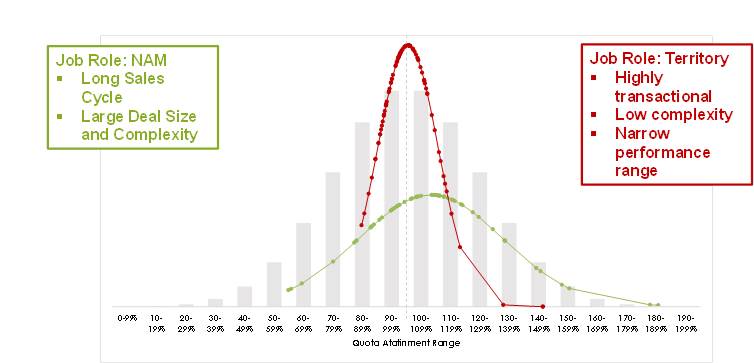
Redesign Your Quota Programs With Alexander Group
When it comes to quotas, there’s a lot a stake … a lot more than most leaders probably realize, given how few actually take the time to do the analysis correctly. Analysis of quota performance distributions yields a wide range of insights to improve the quality of your quota program and thus the performance and health of the sales force and the ROI on your sales investment. Determine which sub-groups to review based on the structure of your organization and your sense for specific problem and opportunity areas. From there, you can formulate hypotheses about root causes, dig deeper where needed, and more importantly, change how you set goals next year.
Do you analyze your quota distributions? How do they look? To learn more about how to assess and redesign your quota programs, please visit our Quotas Practice.

Need Help?
Contact one of our Business Services practice leads to see how we can support your efforts.