Analytics in action: a financial services firm finds the way back to growth

Sales analytics diagnose and solve specific sales-related problems using AGI’s sales utilization framework. The framework helps sales leaders identify and use the right metrics for guiding sales organizations toward the insights they need using five drivers: investment, alignment, execution, perception, and results.
Today’s story: The utilization framework shows a Financial Services Firm the way back to high growth: invest in lead generation and value selling
After several years of high-octane growth, a financial services company started to see growth rates dramatically decline. Senior leadership believed the growth decline was due in part to a sub-optimal sales model. They hired Alexander Group to assess their sales organization and recommend how to get back on a path of high growth.
INVESTMENT and ALIGNMENT
We began by analyzing sales expenditures across multiple categories, and investment in lead generation quickly emerged as a significant red flag. The company was investing only $2.2K per sales rep per year in lead generation, or a fraction (less than 15%) of the industry benchmark of $15k (see Table 1 below). A look at headcount ratios provided further evidence: only one lead generation rep for every 221 sales reps, compared to the industry benchmark of one for every 13 sales reps.
Table 1:
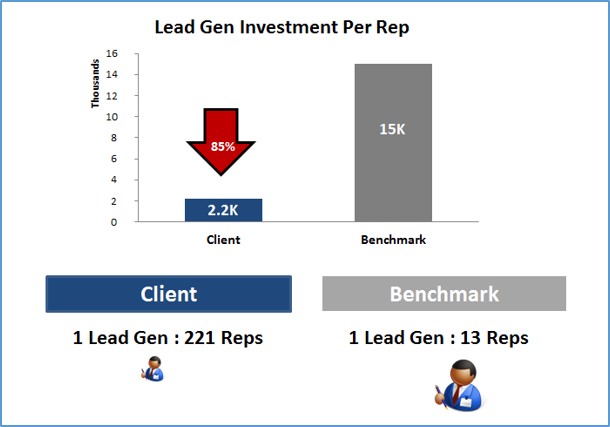
The company was clearly underinvesting in lead generation. The Alexander Group recommended developing a formalized process for lead generation and plans to begin ramping investment in lead generation headcount in order to create a lead gen “engine” that would produce sufficient, high-quality leads.
EXECUTION
Next we evaluated the time allocation of the sales reps through a field survey. The survey showed that hunter reps were spending a disproportionate amount of time in non-selling activities, namely customer service and admin/reporting (sales completion activities, Table 2). Hunters were spending 4-6 weeks on post commitment processes for every sale, more than three times longer than what management believed to be best practice. In essence, the hunter team had become project managers, which left them with limited bandwidth for actual hunting. Post-sale commitments kept reps from high-value, sales generating activities. One manager noted, “The process … takes much more time than it should and takes a lot of time away from prospecting, planning and executing deals. I often need to step in to escalate certain deals.”
Table 2:
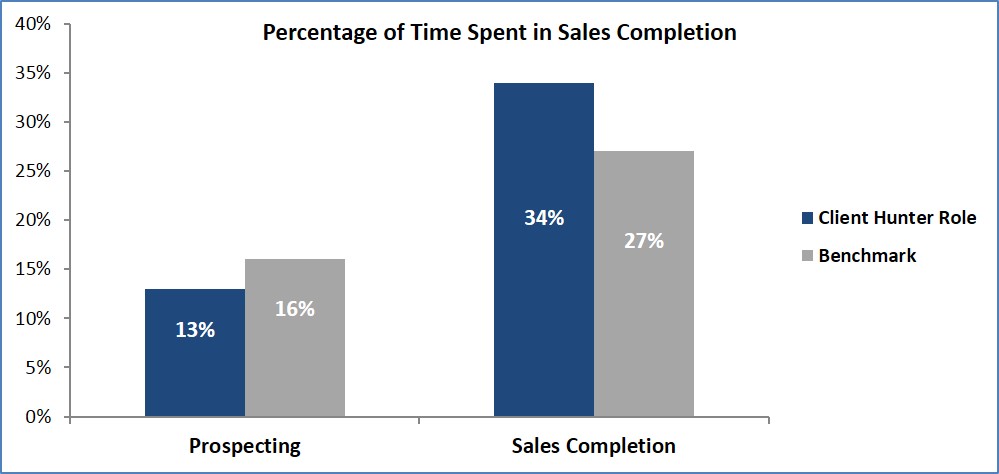
This analysis revealed a huge opportunity — reduce the rep’s time spent in post-sale activities and they could reduce the typical sales cycle by more than three weeks, which could increase annual rep productivity by an average of $250K!
PERCEPTION
Sales rep perception is an important driver of productivity and the fourth element of the framework. We gathered the sales reps’ perception through the field survey, and the findings confirmed the need for greater investment in lead generation, as pointed out earlier. In fact, 77 percent of reps believed the organization did not generate enough high-quality leads. Manager feedback added more fuel to the fire. One manager was quoted as saying, “There is no lead generation function. I have to generate all of the leads for me and my team.”
RESULTS
Finally, we evaluated actual sales results as the fifth and final driver. There are many ways to evaluate results beyond just sales volume or quota attainment. In this case, because the company was focused on driving larger, higher margin portfolio selling, we analyzed the sales force’s ability to sell on “overall value” as opposed to “products and features.” The survey data indicated most sales reps had trouble selling based on value. In fact only 13 percent of respondents explicitly agreed that they sell on overall value rather than products and features. Interestingly, when we analyzed the sales results of these same reps, they indeed had both higher engaged selling time and larger average deals. We conducted this analysis for three different roles (marked Role 1, 2 and 3 in Table 3, below). The results were stunning. Reps in Roles 1 and 2 who indicated the ability to “value sell” sold deals that were 100 percent larger than their “product and feature” selling counterparts. And value selling reps in Roles 2 and 3 had close rates 30 percent and 42 percent higher, respectively, than reps who sold based on products and features.
Table 3:
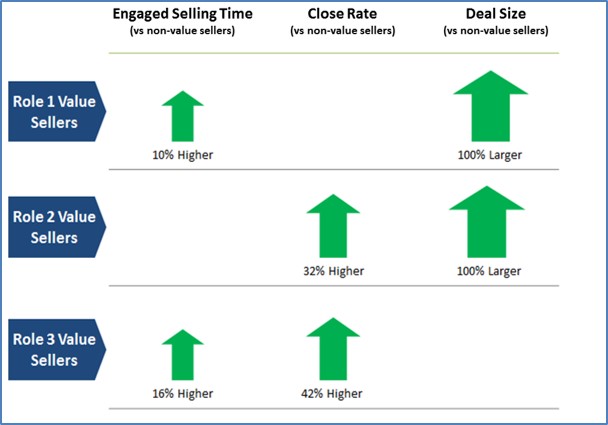
This was a tremendous insight — guiding the company to place greater emphasis on value selling. To increase value selling among reps, AGI recommended creating a centralized customer intelligence team geared towards driving insights and understanding customer needs to provide the reps the value messaging they needed.
Using the Alexander Group’s sales utilization framework, this financial services company gained a clear-eyed picture of how to get back to high growth. By examining all five areas of sales utilization, the company came out of the assessment with a short list of priority items to focus on.
How clear is your picture for improving sales results? Want to learn more? Contact the Alexander Group’s Sales Benchmarking practice for more information on how your organization can benefit from a sales utilization assessment.
Co-Author: Greg Ketchum, Business Analyst in our San Francisco office.