What do sales analytics, sales utilization and Legos have in common?
The need for sales analytics has never been greater.
The typical B2B company spends roughly 20 cents per dollar of revenue on the sales force. That equates to over half a million per year per quota-carrying rep. It’s no wonder that companies place great importance on understanding the return on sales investments. To this end, companies are increasing their investment in sales analytics. A recent leadership poll by the Alexander Group revealed 91% of those surveyed rate sales analytics as important (24%) or very important (67%). Four out of five said they have a sales analytics initiative underway now. Yet exactly zero leaders surveyed rated themselves as “very effective” at sales analytics. In fact, 39% rated their current level of effectiveness as either low or very low.
Sales Asset Utilization
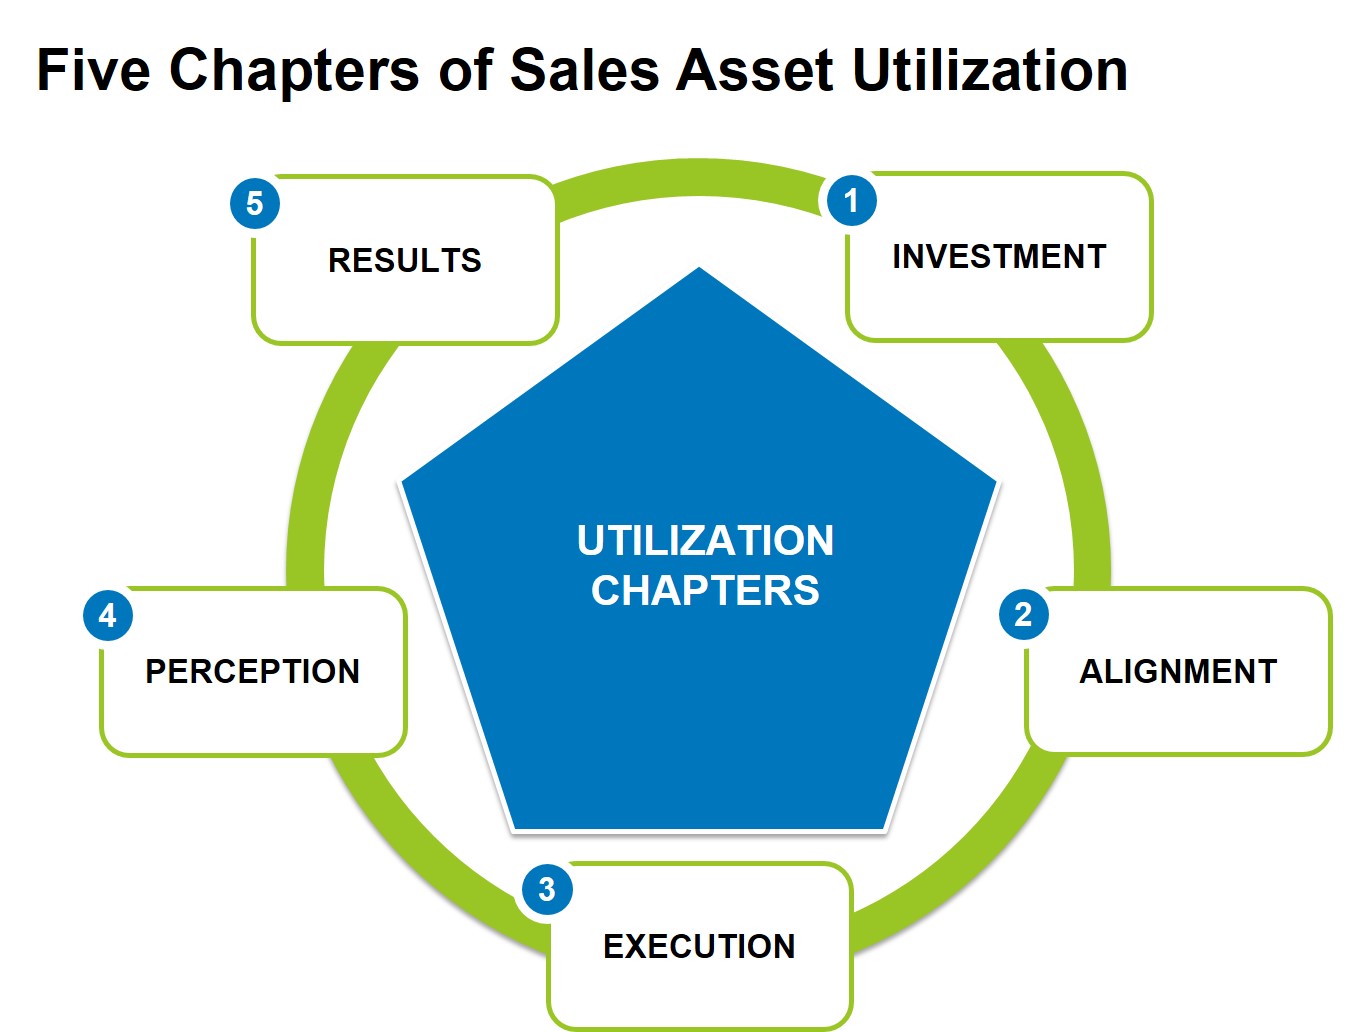
Why is there such strong interest in sales analytics and such poor levels of effectiveness? Certainly IT prowess, legacy systems, lack of data, company culture and any of the other typical IT project inhibitors could apply. But it also has to do with understanding sales utilization. Sales utilization, or the rate of utility you are achieving from your sales assets, is a fairly simple concept. But in practice, it can be quite complex. A holistic and actionable view of sales asset utilization needs to consider five key utilization drivers:
1. Investment: Are you making the right investments in your sales assets?
2. Alignment: Are sales reps focused on the right priorities?
3. Execution: Is the sales team delivering what’s been asked of them?
4. Perception: Do sales reps believe they have the skills and tools to be successful?
5. Results: Is the organization meeting and exceeding its objectives?
For the uninitiated, Legos are a toy that has been around since the 1950s where “builders” use a wide range of shapes, sizes and colored pieces to create different objects. Depending on how the user (builder) puts the various pieces together, you can end up with very different creations/outcomes. Similarly, sales organizations are comprised of various roles, programs, tools, processes and individuals; the combination of which creates the underpinnings of sales utilization. Legos have only increased in popularity since the recent release of “The LEGO® Movie,” where an ordinary, everyday Lego construction worker – Emmet – is able to help save the Lego world. In the course of his journey, Emmet meets the Master Builders, popular Lego characters who possess extraordinary Lego-building skills. Emmet is able to save the Lego world in part because he convinces the Master Builders to focus their unique skills using a “set of instructions” and work together, to prevent “President Business” from using “K-r-a-G-l-e” (i.e., Krazy® Glue) to end the world.
Sales Master Builders
If only building a sales force was as easy as following a set of Lego instructions. Even if a set of sales building instructions was available, it would need to be unique to the company’s situation and needs. Like the Lego Millennium Falcon and X1 Ninja Charger kits, a different combination of pieces and processes is needed to achieve each builder’s desired results. While a step-by-step multi-colored booklet with pictures might not be realistic, there are certainly frameworks and guidelines to help Sales Master Builders in their quest. And that brings us back to the concept of sales asset utilization. Part of being an effective Sales Master Builder is being able to identify and correct under-utilization.
Under-utilization
Many sales organizations are faced with the under-utilization of their sales assets. Legacy processes, shifting customer and market needs, new products and personnel changes are among the possible culprits. The impact of sales under-utilization can be significant and can manifest itself through a number of symptoms, including:
- Low-engaged selling time
- High sales rep turnover
- Slow new hire ramp times
- Over-/under-deployed pre-sales and technical sales resources
- Long sales cycles, unclear process
- Insufficient focus on new products/solutions or new customers
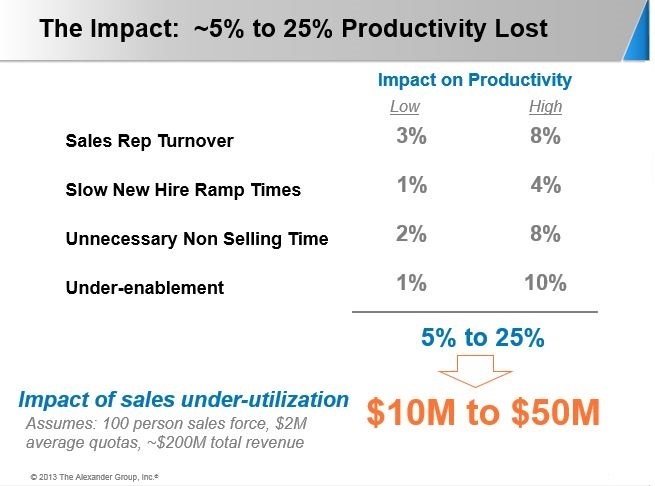
Consider a 100-person sales force, with each seller having a $2MM quota ($200MM total revenue). The metrics in Figure 1 are from Alexander Group’s sales benchmarking database. The data suggest that taken together, these four factors alone can negatively impact productivity as much as 5 – 25%.
Sales Master Builders and Improved Utilization
The need to improve sales utilization typically starts with a sales leader asking himself three key questions:
- Do I have the right strategy and plan?
- How well am I executing against my plan?
- How do we stay ahead of the competition?
And that’s where applying the right sales analytics can make a significant difference. It might not be as simple as a set of Lego instructions, but having the right approach, right data and right context, coupled with the right experience, can help Sales Master Builders assess their current “build” and determine whether configuration changes (e.g., swapping out pieces, putting them together in different ways) will drive improvements in sales utilization.
The Problem: The problem is, too many leaders overlook the full picture of sales utilization and the impact it has on building an effective sales organization. It’s like wanting to build something cool with Legos but not having the instructions to do so. With the advent of “Big Data” and improved technology, most sales leaders do not suffer from a lack of metrics. But do they put the right metrics together in a way that provides the best insights (i.e., providing a proxy for instructions)? Measuring asset utilization helps with funding allocations, initiative prioritization and objective setting. Just as other parts of the enterprise track the utilization of assets (production lines, inventory, financial assets), so too should the sales function monitor sales utilization on an ongoing basis to ensure the success of the annual plan. So measuring sales utilization is a good thing. But how does a Sales Master Builder get started?
The Instructions: Most Lego sets sold today come with a step-by-step set of easy-to-follow instructions. Building (and rebuilding) a sales force is not quite the same, but the Alexander Group’s Sales Utilization Framework serves as a valuable guidebook of design principles for sales leaders. It has five parts or chapters: Investment, Alignment, Execution, Perception and Results.
Chapter One: Investment
Are you investing in the right sales assets? If you want to build the Millennium Falcon out of Legos, you need to have the right pieces in the right quantity. Too many and you have lots of pieces left over that don’t get used; they are under-utilized. Too few and the ship doesn’t have a laser or defense shield, leaving its passengers exposed when the enemy attacks. Sales investment is similar—you have a limited budget but you must spend it wisely. How you spend it drives everything from headcount, customer coverage, enablement and field marketing programs. The metrics to evaluate sales investment should include Expense-to-Revenue, Compensation Cost of Sales, Enablement per Rep, and Total Sales Cost per Rep. Determine the right set of metrics for your organization but recognize their strengths and weaknesses. For example, Sales E/R is one of the more common investment-related metrics. The typical organization spends approximately 20 cents per dollar of revenue on sales. While E/R is useful as a directional indicator, it is not an effective predictor of sales performance. Sales leaders should balance using total Sales E/R with other metrics such as dollars per organic or discrete quota-carrying rep. This will help leaders to evaluate the right balance of discrete quota-carrying reps (basic sales building blocks) with lead generation roles, specialist roles (product, technical, vertical), channel roles, management roles and support roles (those fancy and unique Lego pieces) to ensure the right coverage model design. Several factors drive these decisions including your industry, your organization’s size and stage of growth, your market and account segmentation and targeting model and your growth aspirations.
Chapter Two: Alignment
Once you’ve determined the right level of investment, you’re ready to build. Like assembling Lego bricks, Sales Master Builders need to place the right sales resources against the right customers and make sure the programs, tools and processes are in place to help them focus on the right priorities. This includes defining the right sales motions and having sales playbooks for each to guide the selling process. Sales territories and account assignments must be balanced, appropriate quotas set, and of course, sales compensation plans designed by role to align with the company’s sales strategy. To diagnose utilization, look to metrics that gauge alignment such as territory realization, playbook adoption and engaged selling time. How the different pieces get put together can mean the difference between the Legos turning into a race car, a house or that killer spaceship.
Chapter Three: Execution
Let’s say we built a Formula 1® race car out of our Legos. Now we ask, are we racing it around the office or is it just sitting on the desk? For sales leaders, this translates to whether the sales team is delivering what’s been asked of them. If we targeted a new customer segment this year, are the sellers calling on those accounts? What about that new product that was just launched? Is it being promoted or are we continuing to focus on our legacy solutions? And how do we know? Several metrics can help us evaluate sales execution, most of which center around activities and process. Look for metrics that relate to the specific strategy being pursued. New logos, new product sales, customer retention and penetration are good lagging indicators. While account prioritization, pipeline metrics (size, shape, velocity) and lead generation are good leading indicators for evaluating execution, we want our sales build to work and work well. The Lego race car might look cool, but if it’s slow and fragile, it won’t get the job done and will require some redesigning and rebuilding.
Chapter Four: Perception
On the surface, perception can be as simple as “Was the race car easy to build?” or “Did I have fun?” But a focused effort measuring sales perception represents a significant opportunity for Sales Master Builders. Measuring perception leads to important insights around sales programs and their impact. The example below is from an enterprise software company. While a gap between what the field views as important and the company’s effectiveness is relatively common, what stands out is the size of the divergence.
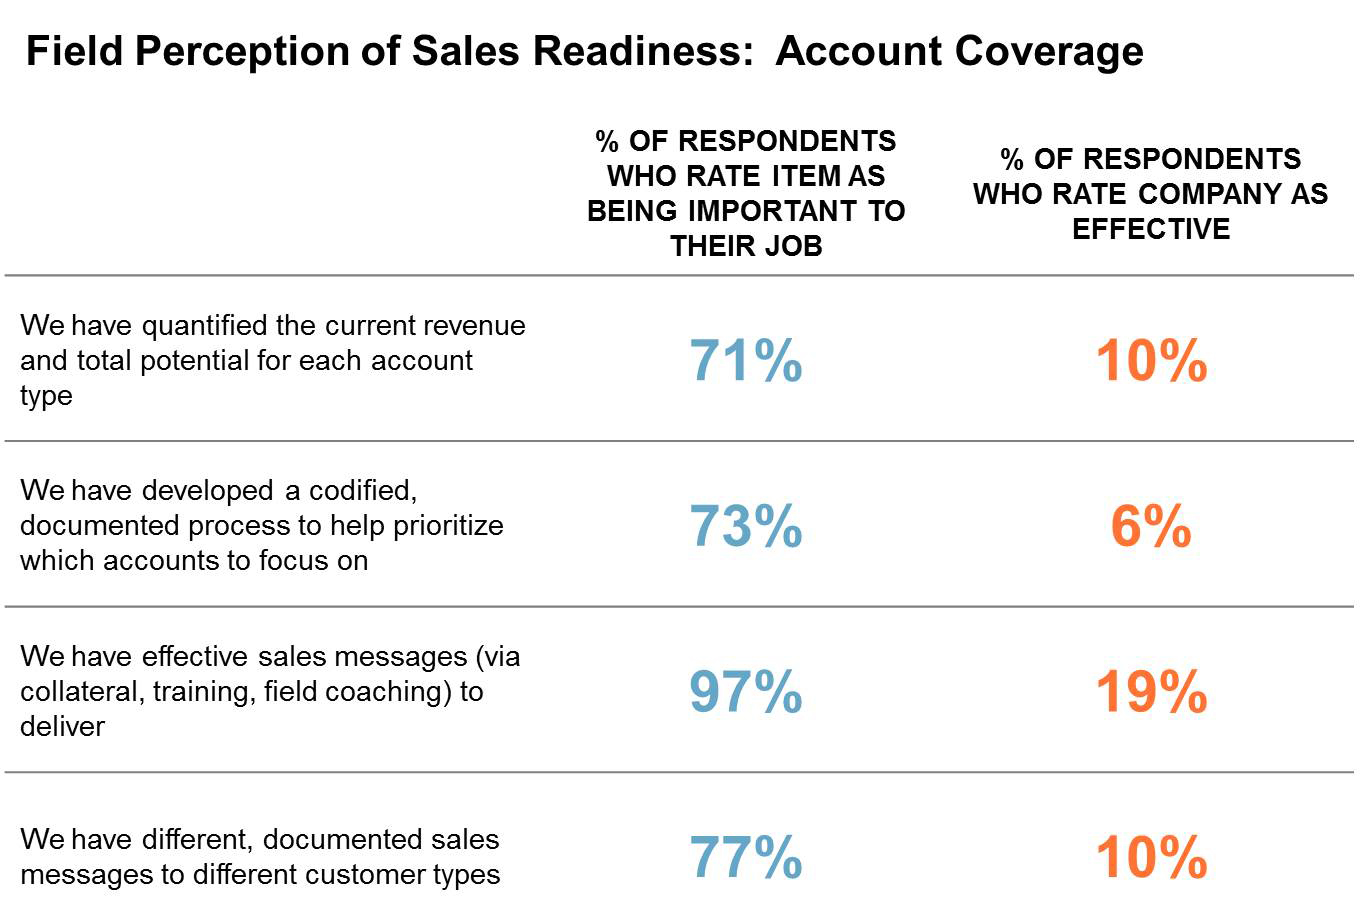
As part of an overall assessment of sales effectiveness, the above findings helped management recognize the need to re-design a range of programs including the lead generation process, account coverage and prioritization, the sales process and enablement programs. For Sales Master Builders looking to measure perception, important focus areas should include segmentation and targeting of the market, the company’s value proposition, coverage, the sales process, job clarity and focus, development and compensation. With the field’s input around what’s important and how the company is doing, senior management is better able to evaluate the success of programs underway, course correct (or reinforce success) and prioritize new investments.
Chapter Five: Results
The sales organization is ultimately measured on the results they deliver to the organization. Did they meet the sales targets and expense budgets? Results tell us how well we did, whether we made good decisions and how much we’re being paid. In terms of reporting and analytics, there tends to be an overabundance of results-based metrics–which isn’t a surprise given the nature of available data in many organizations. But too often results are tracked, congratulations (or reprimands) shared, and the sales organization moves on to “What have you done for me lately?” This is a missed opportunity for Sales Master Builders. Within the context of the sales utilization framework, the Results chapter serves as a critical feedback mechanism for chapters 1 through 4. For our Formula 1 Lego car, we might think about the results of how much the car was played with or whether it won the “Office Grand Prix.” But we miss an opportunity if we glory in the big win, put the car back on the desk and go straight online to buy a new box of bricks.
Course Correcting: Strategic vs. Tactical
As an element of the Utilization Framework, a careful analysis of results has both strategic and tactical implications. It might be that the best course of action is to enhance our current strategy: Ensure we buy the right pieces for a new car and get the best deal, as well as rotate the wheels to maximize speed and carve out time in our busy schedule for the next race. Alternatively, we might conclude a new strategy is in order and that we should be in a different race altogether; perhaps an interplanetary grand prix for space cruisers. The results measurement challenge is commonly one of focus. With so much data available, finding the right feedback metrics can be difficult. Metrics should be selected and used in two important ways: 1) Ongoing success of the business–the dashboard and report metrics used in the day-to-day management of the organization (running the race). Operational metrics are commonly the ones that are available in overabundance and require a critical review to identify the few that are most useful. 2) Testing strategic hypothesis–metrics and analyses that are used to validate strategy and identify new business opportunities. Selecting the metrics for hypothesis testing is part of the strategy review process itself. As part of the process, Sales Master Builders need to identify critical, but specific, questions (e.g., Which race on the calendar is the best one for me?). Based on available data, the best combination of metrics can be identified and put into practice.
Getting Started
For sales leaders looking to improve sales utilization, the first step is to create a baseline. Using the Sales Utilization Framework as a guide, inventory the metrics used to manage the organization today. We’ve mapped some key metrics in the example below:
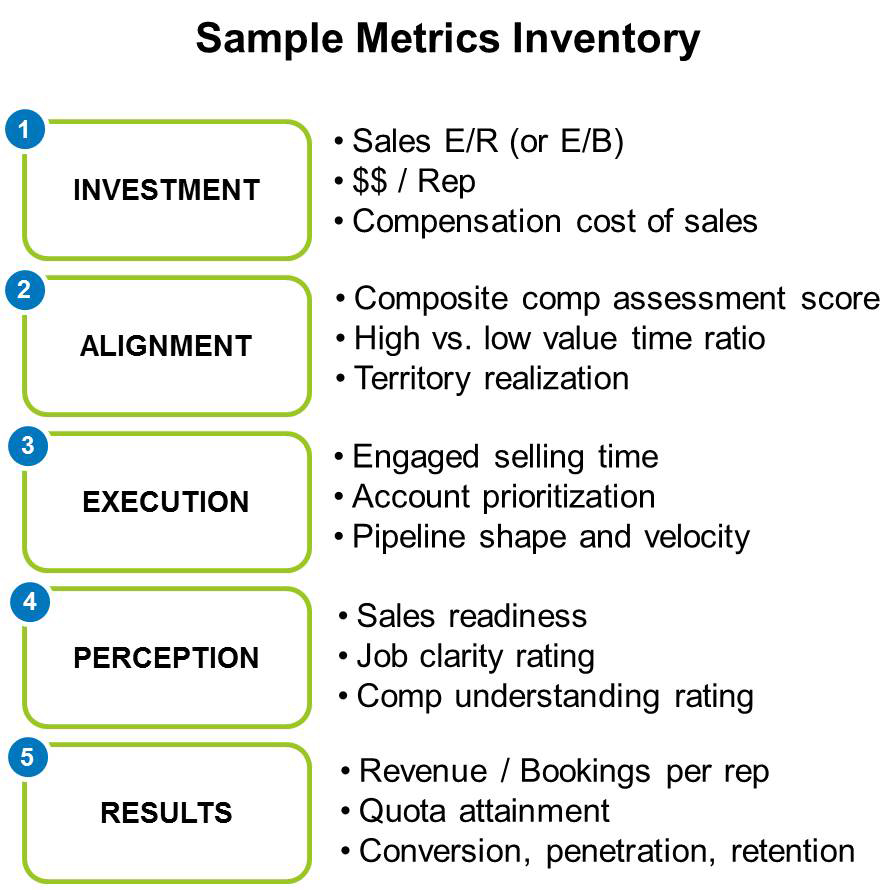
Next you’ll want to compare the metrics across groups both internally and outside the company. Identify gaps in both the types of metrics (e.g., lack of metrics around perception) and the data collected (e.g., revenue per rep below market). From there, it’s possible to identify actionable improvement opportunities based on findings and determine what metrics need to be collected going forward.
How is your company’s sales utilization? How effectively do you track and manage it? Contact Alexander Group to learn how we can help.