Misalignment or poor execution of quota assignment can have significant negative consequences for the company, including missed sales goals, loss of top talent and sales compensation costs that are significantly over budget.
Most companies use sales compensation to drive sales objectives, reward sales results and manage costs. A sales compensation plan’s success is dependent on a company’s effective implementation of several foundational elements. At the Alexander Group, we view quota assignment, or allocation, as the most important of these foundational elements. Misalignment or poor execution of quota assignment can have significant negative consequences for the company, including missed sales goals, loss of top talent and sales compensation costs that are significantly over budget.
Sales compensation professionals agree that most sales reps should achieve or exceed quota. The exact percent—60%, 70%, or more—is a factor of the plan structure and the company’s philosophy on rewarding its top performers.
This whitepaper will examine prevalent quota setting practice and the impact of setting quotas “too high” or “too low.” The paper will expose what tends to go wrong with quota setting and compensation plan design leading to higher-than-targeted incentive payouts.
The paper will draw on three sets of analyses. The first set of analysis will provide empirical evidence of the positively skewed distribution for quota attainment. The distributions used in the analysis represent actual quota attainment for a cross-section of roles across a variety of industries and were selected at random. The second set of analyses will examine compensation cost impacts under various quota setting and allocation scenarios. The third set of analyses, based on one a priori assumption: quotas are fair, accurate and communicated to the sales force in a clear, consistent and timely manner, will examine factors that mitigate the overpayment.
The Three Sets of Analyses
Empirical Evidence
Compensation Costs Impact
Quotas are Fair
The Long Right Tail
Sales rep quota attainment is generally observed to follow a positively skewed distribution. In such a case, a majority of the observations are grouped to the left of the distribution with a few cases reaching far to the right—the long right tail. Figure 1 below shows the attainment distribution for six roles across four industries (industries highlighted in bold).
1. Inside Sales Representative – Outbound: Software & Programming
2. Regional Sales Manager: Software
3. Channel Account Manager: Software
4. Product Specialist – Cardiovascular Specialist: Medical Devices
5. Named Account Manager: Online Advertising
6. Territory Account Manager: Software & Security
Figure 1


In the current format, the charts are used simply to illustrate the positively skewed nature of the distributions. The x-axis represents quota attainment, which is based on an individual goal of revenue dollars. In subsequent views the axes will be standardized for additional analysis and observations.
Each of the six charts shows evidence of the long right tail; the attainment distributions are positively skewed. Normally distributed data has a skewness score of zero. The table below (Figure 2) shows the skewness score for each distribution. Higher scores indicate a longer tail, which ultimately indicates higher incentive compensation payouts.
Figure 2
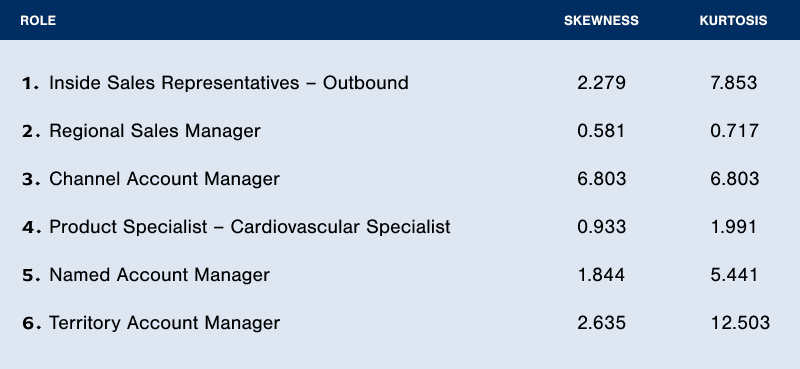
High level of attainment is naturally a significant incentive compensation cost driver. Particularly interesting is the high level of minimum attainment for roles 2, 3, 4 and 5. For example, 69.9% is the lowest level of quota attainment for the cardiovascular specialist, role 4. Such a high level of attainment for the lowest performing rep will invariably drive high incentive compensation payouts. The high attainment could be the result of poor quota setting; goals are set too low.
In addition to a long right tail, all six distributions also display a positive kurtosis. There is some debate in the scientific community whether kurtosis is primarily a measure of ‘peakedness’ or ‘tail heaviness.’ Generally, data with low (negative) kurtosis tend to have a flat top near the mean and light tails, while data with high kurtosis (positive) tend to have a sharp peak and heavy tails. In Figure 3, all six distributions—in their entirety—are overlaid on standardized axes. In Figure 4, the axes have been truncated to provide a clearer, more detailed view.
Figure 3

Figure 4

The variability in attainment distribution curves across the six roles is immediately evident. The high variability suggest that there is no one ideal distribution and that an across-the board recommendation that 2/3 of sales reps should achieve or exceed quotas can lead to significantly different incentive compensation payouts based on the plan mechanics. For example, incentive compensation payout under a ‘3x’ plan (Figure 5) will be much higher for the regional sales manager than for the named account manager (Figure 6). The reasons are three-fold:
- About 73% of NAMs are at or above quota; only 50% of RSMs are at or above quota
- NAMs have a long tail; RSMs have a comparatively short tail
- The lowest attainment by a NAM is 70% – quotas may be set too low; the lowest attainment by an RSM is 45% of quota
Attainment distributions also tend to vary by sales role—taking quota setting and allocation aside—though the correlation is relatively weak. In general, sales reps with a high level of individual persuasions, tied to an individual goal will have a more normal (less skewed, less bunched) distribution than sales reps with limited level of individual persuasion, tied to a team goal.
Figure 5

Figure 6

Setting Fair, Accurate Quotas
A Solid Foundation
As a company grows and matures, that is, enters Phase III of the growth phase continuum, its ability to effectively allocate quotas becomes a critical productivity and cost-management driver. How companies set quotas varies. Alexander Group’s 2015 Sales Compensation Trends Survey reveals that companies use a variety of quota allocation methodologies including top-down simple increase, bottom-up sales potential, fair or modified fair share allocation, or a hybrid version of one of the above.
Regardless of the methodology, a compensation plan cannot succeed without a well-thought out and implemented quota allocation process. Despite good intentions, the process sometimes “goes bad.” When this does happen, the noncompensation cost related side effects include low morale, increased voluntary turnover, and quota pushing/pulling. Often, these side effects can have a greater negative effect on the company than the increased compensation costs and revenue/bookings loss examined in the next section.
When Quotas
“Go Bad”
Financial Impacts and What to Do About It
The shape of the quota distribution curve tells a lot about a company’s quota setting and quota allocation practice—assuming no significant external shocks to the economy, competitive landscape, consumer demand, etc. Uneven or lumpy distribution—where many sales reps are bunched or lumped in a few specific percentiles—indicates a process that is misaligned with market opportunity.
Two major things can go wrong in the process: the quota setting and the quota allocation, each of which can have a significant negative financial impact on the company. The interesting scenarios, from a cost perspective, are when quotas are set too low (many overachievers) and too high (few overachievers).
The table below (Figure 9) contrasts the two distribution scenarios referenced in the previous section using the MM AE plan structure with particular emphasis on three key cost components:
- Actual Goal Attainment as % of Goal
- Actual Incentive as % of Target Incentive
- Cost of Sales
Figure 9
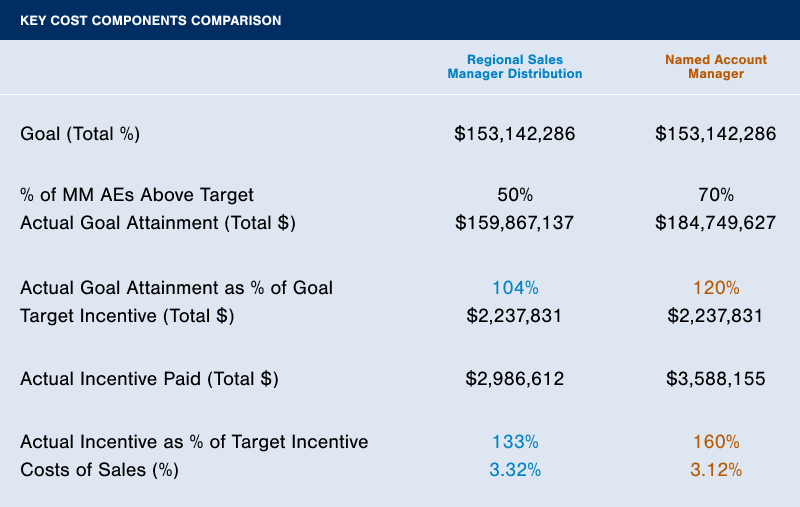
As expected the actual Incentive as % of target incentive payout is much greater for the NAM Distribution. The cost of sales is lower due to the greater quota achievement. The more obvious scenario with negative impact is the ‘quotas too low’ scenarios—NAM Distribution. In this scenario the sales reps will indeed bring in more sales revenue than originally projected by the company—this is generally seen as positive. However, the incentive payout is much higher than the target amount. This fact will make planning and compensation administration a nightmare. Another more subtle negative impact of setting quotas too low is the concept of money left on the table. Generally sales reps respond well to stretch goals. Could quotas have been set higher? In all likelihood yes—the lowest performer attained 73% of target.
By setting quota too high the impact on the company is less tangible from a financial perspective. The cost of sales is in fact higher, in itself a sign of misalignment. The real impact however is inevitable decrease in employee morale and subsequent rise in turnover. Additionally, the company will suffer through tough Wall Street scrutiny and shareholder backlash when it reports poor annual performance.
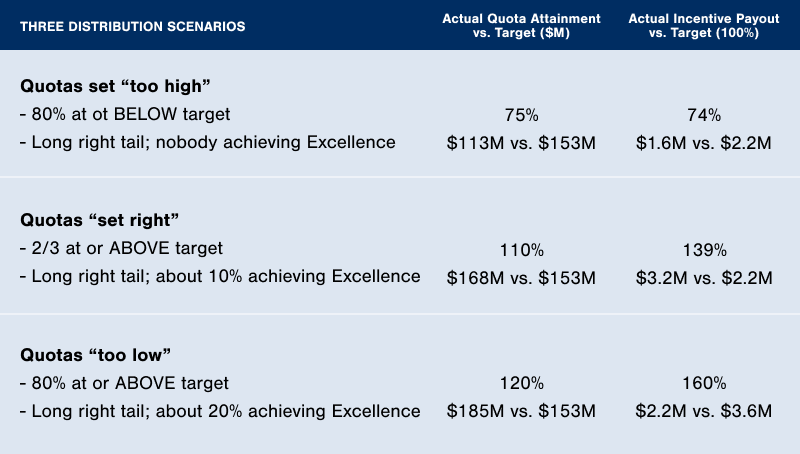
When companies don’t adhere to the 2/3 attainment guideline when setting quotas, thus creating heavily skewed distributions with a lot of individuals bunched together (high kurtosis), the incentive costs can be quite high and company goals widely missed. Figure 10 below shows the comparison of two exaggerated distributions versus the control, 2/3 distribution assuming the outlined pay curve structure in Figures 5 and 8.
The target incentive payouts and quota attainment numbers under the two extreme scenarios point to the suboptimal nature of these distributions. Companies experiencing high growth often find themselves in ‘overpayment’ situations. This is natural as it’s often difficult to accurately set and allocate quota in an everchanging marketplace. Conversely, companies experiencing low growth tend to find themselves in ‘underpayment’ situations. In these situations, the company is often trying to spur additional growth through an aggressive quota setting program—often leading to an attainment distribution where few reps achieve quota.
Figure 10
Strategic change via the marketplace, new products, product maturation and a host of other drivers are behind these major tactical sales plan redesigns.
About Alexander Group
Alexander Group understands your revenue growth challenges. Since 1985, we’ve served more than 3,000 companies across the globe. This experience gives us not only a highly sophisticated set of best practices to grow revenue—we also have a rich repository of unique industry data that informs all our recommendations. Aligning product, marketing, operations and finance efforts behind a successful sales organization takes insight and hard work. We help the world’s leading organizations build the right revenue vision, transform their organizations and deliver results.
More Resources