

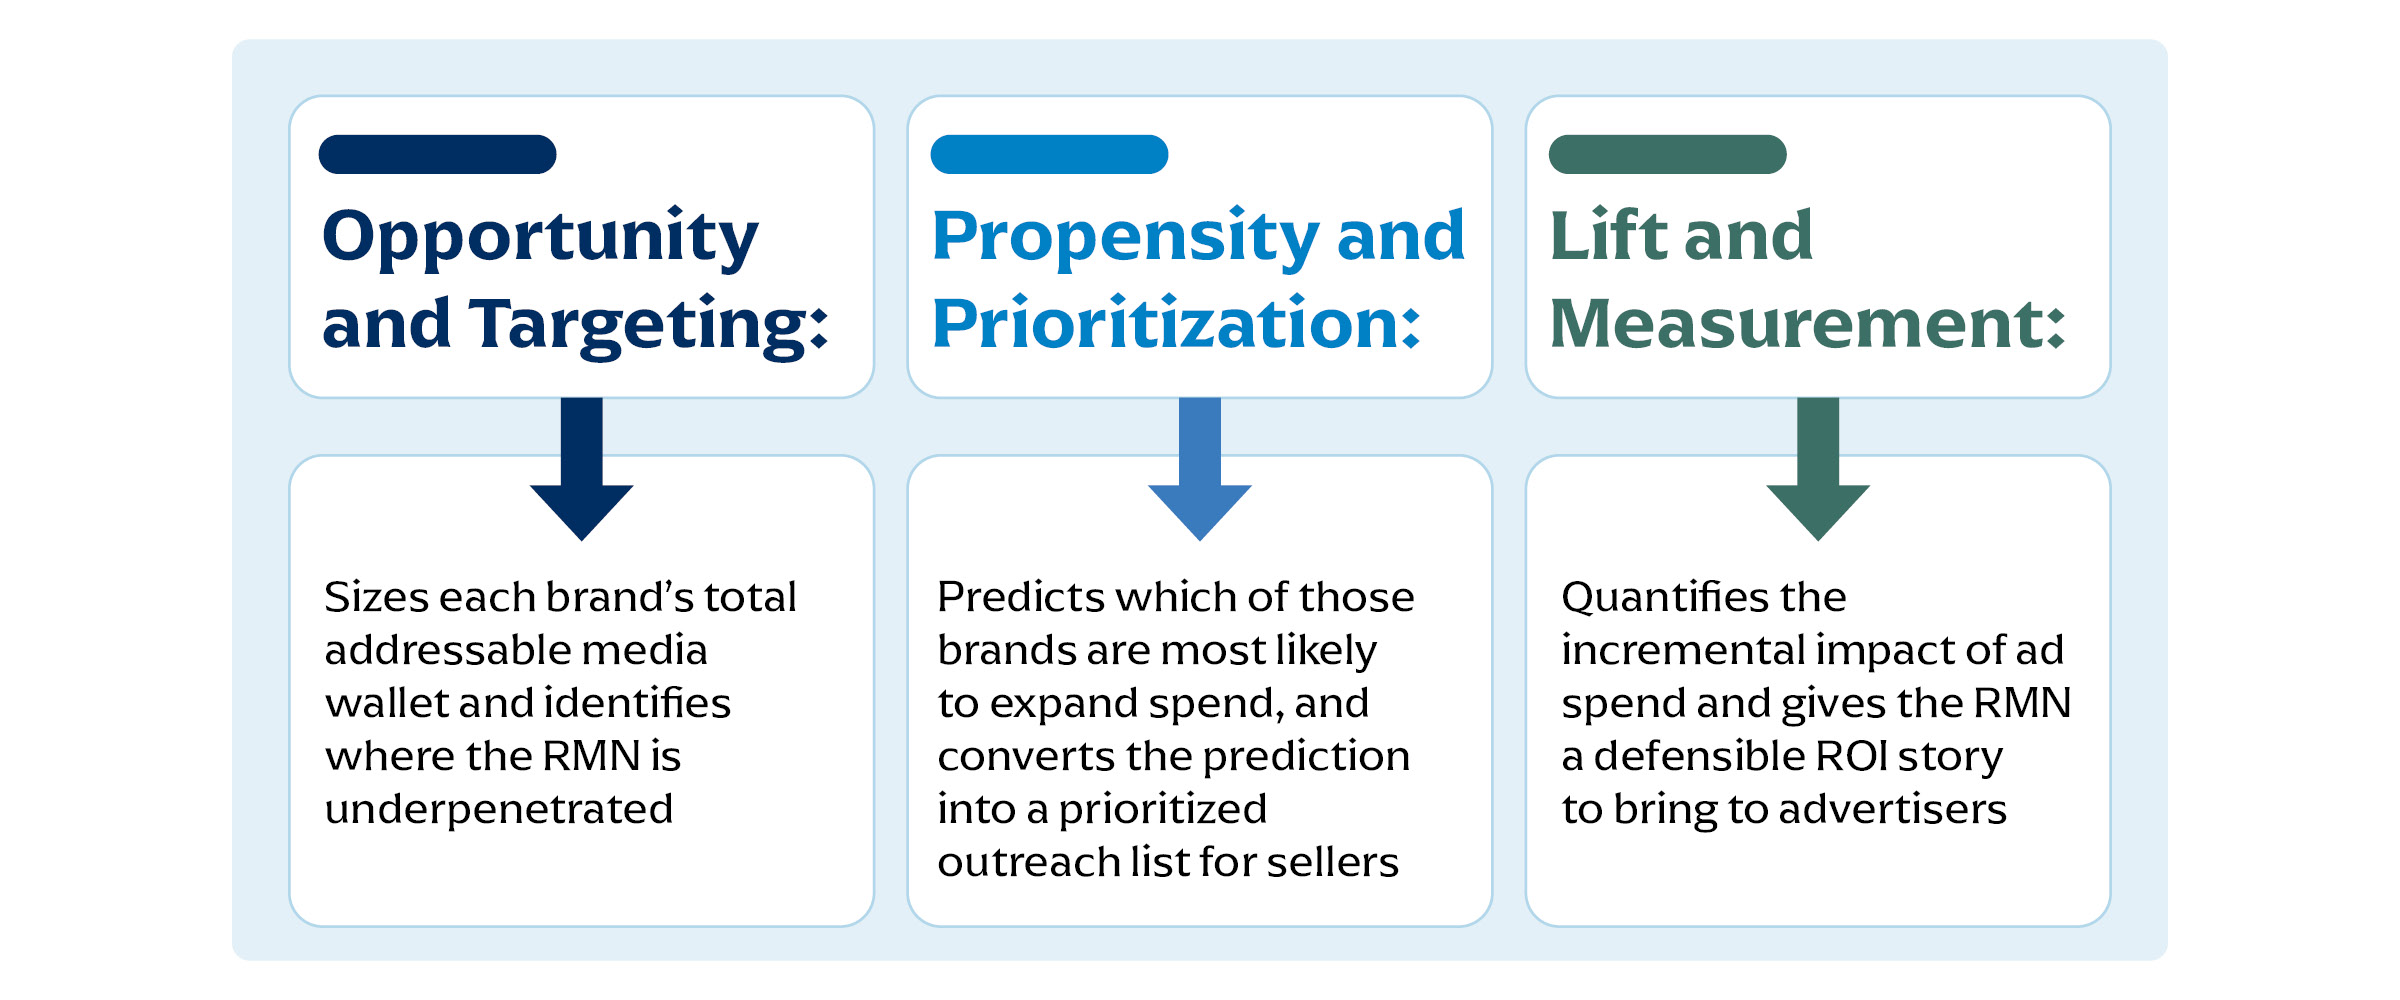
Opportunity and Targeting. The first model sizes each brand’s total addressable media wallet and identifies where the RMN is underpenetrated. It combines the network’s first-party data (ad sales history, merch relationships and audience data) with ad spend intelligence that tracks brand-level investment across channels. The output is a brand-level view of estimated wallet versus current spend, along with a clear read on where the RMN has a right to win based on category fit, audience overlap and past performance.
For endemic brands, the model has rich signal to work with. Merchandise relationship depth, category sales performance, sell-through and historical ad activity all indicate which brands are most invested in the category and where the network is leaving spend on the table. The model turns that into a ranked view of endemic wallet the network hasn’t captured yet, which is often the fastest, highest-confidence revenue available.
These merchandise signals don’t exist for non-endemic brands, so audience overlap becomes the dominant fit criterion. It can be calculated at three levels of sophistication. The simplest is attribute-based similarity, comparing the retailer’s shopper audience to a brand’s target audience along demographic, behavioral and lifestyle segments. The second is shared media behavior, comparing the media footprints of the endemic brands the network already sells against the footprints of non-endemic prospects; brands buying the same publishers, programs and sponsorships are revealing that they value the same audience, and the network can score each prospect against the aggregate footprint of its endemic portfolio. The third and most rigorous is direct household-level matching, using panel providers or identity graphs to profile the retailer’s customer file and quantify overlap with the buyer profiles of specific non-endemic brands. Most networks build at the level their data allows and add signals as their infrastructure matures.
Propensity and Prioritization. The second model predicts which of those brands are most likely to expand spend and converts the prediction into a prioritized outreach list for sellers. It uses audience overlap, merch relationship depth, historical media activity, firmographic data and intent signals to score brands on likelihood to grow. Rather than having a static list as an output, instead it’s a ranked, refreshable view of the next best conversations for the sales team, updated as new signals come in. Compensation design and coverage models only pay off when sellers know which brands to prioritize; without a propensity signal, even a well-designed comp plan pushes sellers toward the accounts they were already going to call.
Lift and Measurement. The third model quantifies the incremental impact of ad spend and gives the RMN a defensible ROI story to bring to advertisers. For endemic brands, this is comparatively straightforward: The network can tie ad exposure to in-store and online sales of the advertised products and report lift directly. It links ad exposure to audience segments, and audience segments to transaction outcomes, using first-party sales data and retail measurement panels where the network’s own coverage is thin. Lift is where the non-endemic case gets structurally harder. When the advertiser’s product is not sold by the retailer, there is no in-store SKU to attribute against, so measurement shifts to audience engagement, brand lift studies and outcomes data where available. The networks that develop credible non-endemic lift methodology now, instead of waiting for the standard to emerge, will be the ones that advertisers trust with growing shares of their budget. The IAB’s 2024 Retail Media Measurement Guidelines are still being adopted across the industry (E-Marketer), so the networks that arrive with a working methodology will help shape the standard rather than react to it.
The models work as a system. As a result, their value compounds only when they are built and refreshed as a connected system. Opportunity feeds propensity, propensity feeds outreach, outreach feeds lift measurement and lift measurement feeds back into opportunity as new brands prove out and new categories open up. The networks that treat this stack as maintained infrastructure, refreshed on a cadence that matches the sales motion, are the ones that close the gap.
Data Needs and Enrichment Sources
The models run on a mix of the RMN’s first-party data and outside enrichment. The first-party layer of ad sales, audience and merchandise data is the foundation, and it is unique to each network. Enrichment fills the gaps: ad spend intelligence for opportunity sizing and propensity, retail measurement panels for lift and incrementality and firmographic as well as intent data for account prioritization. Two practical constraints shape any build. Coverage is uneven, with strong depth in large digital and CPG categories but thinner reach into specialty retail, durables and services. And licensing matters, since raw data is rarely shareable across parties while modelled outputs usually are, which is what pushes most engagements toward a maintained, modelled-output system rather than a one-time data pull.
From Ad Inventory to Analytics Infrastructure
Retail media is no longer a question of whether to build a network. It is a question of what surrounds the network once it is built. The networks that will compete for share are the ones that treat analytics as infrastructure rather than project work: an opportunity model that sizes brand-level wallet, a propensity model that prioritizes seller outreach and a lift model that defends incremental return, all refreshed on a cadence that matches the sales motion they support. That is what turns ad inventory into a durable commercial engine.
[1] EMARKETER. (2025, September 1). US Retail Media Ad Spending Will Near $70 Billion in 2026. EMARKETER. https://www.emarketer.com/chart/c/354785/us-retail-media-ad-spending-will-near-70-billion-2026-354785
[2] EMARKETER. (2025, September 1). US Retail Media Ad Spending Will Near $70 Billion in 2026. EMARKETER. https://www.emarketer.com/chart/c/354785/us-retail-media-ad-spending-will-near-70-billion-2026-354785
[3] EMARKETER. (2025, September 1). US Retail Media Ad Spending Will Near $70 Billion in 2026. EMARKETER. https://www.emarketer.com/chart/c/354785/us-retail-media-ad-spending-will-near-70-billion-2026-354785
[4] EMARKETER. (2024, December 2). 2025 trend: Mounting pressure will squeeze the long tail of Retail Media Networks. EMARKETER. https://www.emarketer.com/content/2025-trend-mounting-pressure-squeeze-long-tail-retail-media-networks
[5] Yuen, M. (2024, July 9). More than half of brands take advantage of non-endemic partnerships. EMARKETER. https://www.emarketer.com/content/brands-take-advantage-of-non-endemic-partnerships