The five red flags of sales asset utilization

It takes six months for a new business-to-business sales rep to be fully productive on average, and in some cases much longer. Once productive, that sales person will spend less than 25 percent of his or her time on engaged selling activities. Is this just an unfortunate reality, or is it a sign that something is seriously wrong with most sales organizations? The answer can be found in the concept of sales asset utilization. Utilization is a commonly used metric across industries and functions. Operations leaders constantly measure and evaluate the utilization of their physical assets like airplanes, hotels or factories. CFOs strive to maximize the return of financial assets. And professional services companies, like law firms and consulting firms, track the utilization of human capital in the form of billable hours.
The fact is under-utilization is everywhere. Relatively less common is the discussion about sales asset utilization – in other words, the utility that leaders and companies achieve from their investments in the sales force. Several studies suggest that an average of 41 percent of sales reps achieve quota, a scenario made worse by the fact that the sales function is expensive. Approximately $900 billion is spent on sales organizations annually. That’s five times the $170 billion spent on all media advertising. Looked at another way, 20 percent of the revenue in a business-to-business organization goes to sales.
Our own research shows that five of the most common utilization drains can impact sales productivity anywhere from 5 – 20 percent. For a sales force of 100 reps, each with a $2MM quota, that’s a $10 – $50M potential impact. Imagine how these numbers balloon for larger organizations!
Evaluating and improving sales asset utilization makes sense conceptually but can be somewhat challenging to put into practice. A first step is to identify the red flags indicating your sales force is under-utilized. Here are five of the most common culprits:
- Slow Ramp Times: The first sign of trouble is slow ramp times for new sales reps relative to their peer group and best practice. Not surprisingly, slow ramp times result in lower performance, missed quotas, increased risk of turnover and higher costs.
- Low Sales Time: When sales people spend too much time on non-selling, or even “low value” activities that might seem worthwhile, like prospecting or cold calling, the impact on productivity can be significant.
- Turnover: The average turnover rate (voluntary and involuntary) for companies in our database is 12 percent. Of course, not all turnover is bad, but all turnover is costly and drains utilization.
- Low Field Confidence: When reps don’t understand the strategy or don’t believe they have the support they need, this further saps utilization. Our research indicates the average rep is not confident in his company’s ability to provide effective sales collateral. In one recent client example, while 90 percent of reps rated good messaging and collateral as “very important,” only 38 percent felt the collateral they received was effective.
- Under-Enablement: Finally, the most subtle and also the most deadly red flag is under-enablement. When it comes to sales, there’s a natural tendency to minimize what already seem to be very high costs. But investing too little, or investing in the wrong areas, can be devastating to sales utilization.
Five red flags, each with the potential to impact utilization and drain productivity. Unfortunately the story doesn’t stop there. The five red flags above represent only some of the most common culprits. There are more, a lot more. Consider the following: poor leads, unbalanced territories, inability to hire good talent, comfort-zone selling, low new-product sales, too few new logos, or too much double crediting, to name a few. All of these lead to higher sales costs and lower utilization.
As we researched the concept of sales utilization, we quickly realized that even though we wanted to identify a finite, limited number of red flags so we could develop specific plans to address those flags, it wasn’t meant to be. We kept recognizing more flags. As a result, we concluded the most effective way to approach the issue is through a measurement approach and framework for sales utilization decision-making.
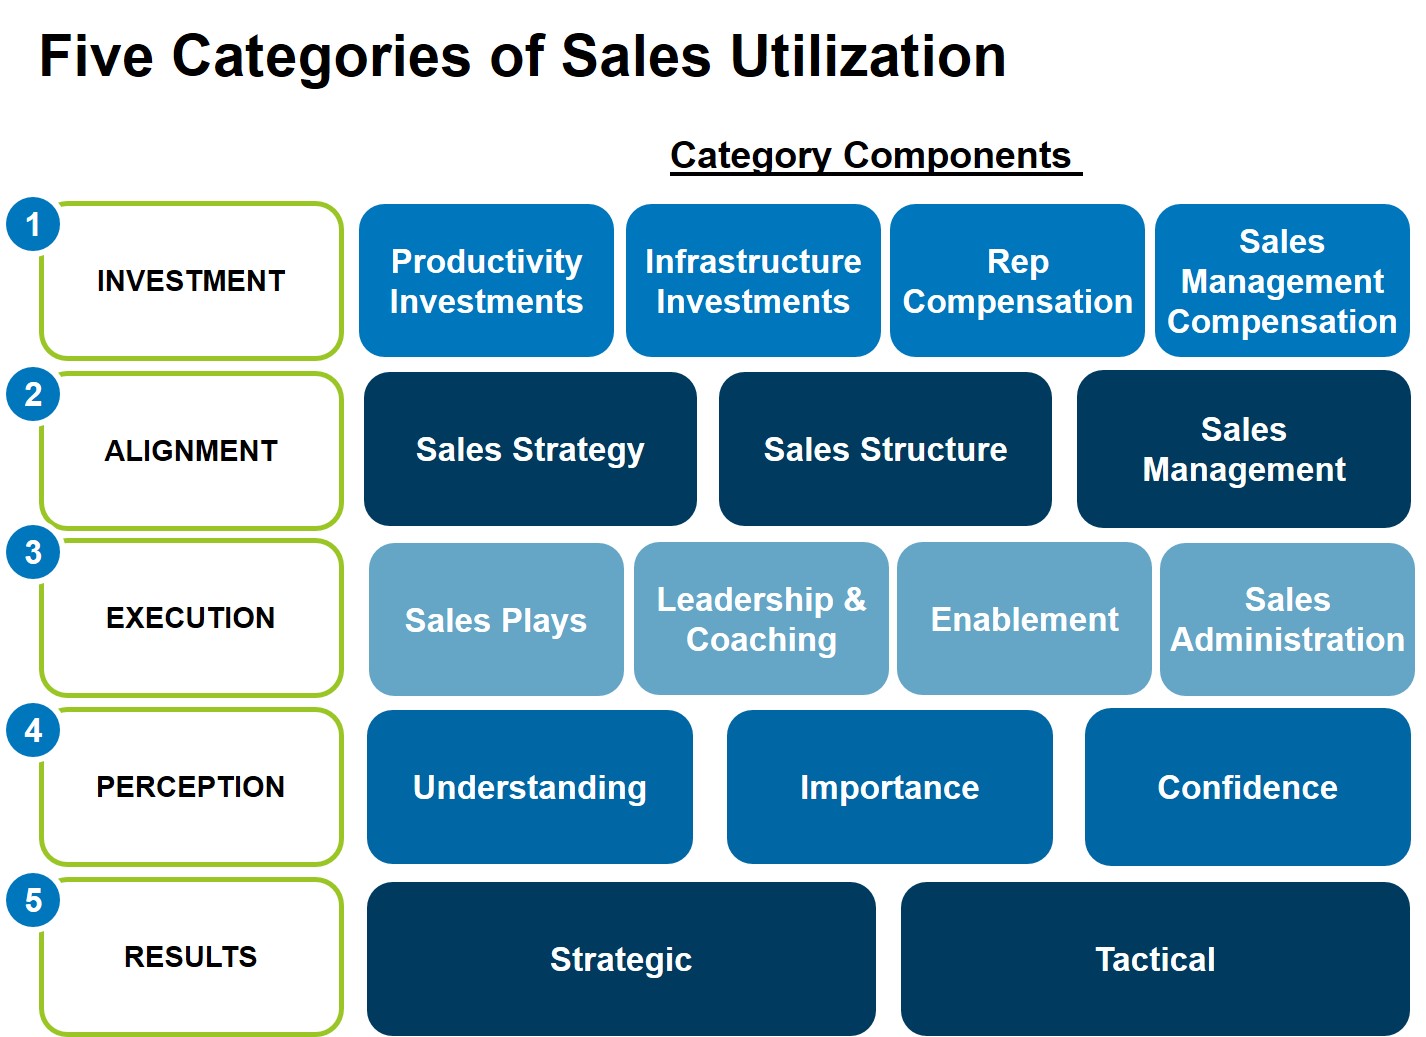
Looking more closely, we find there are five key drivers, or categories, that help create a picture of the organization and provide a way to make planning and strategy decisions; reinforce/course correct the organization’s performance against plan; and benchmark other organizations. The five drivers of utilization are necessarily linked and create a closed-loop process and feedback mechanism. They include:
- Investment: Are you making the right investments in your sales assets? Are you allocating your investments effectively?
- Alignment: Are your sales reps focused on the right priorities? Have you put the pieces of the sales force – the right programs, people and processes – in place to support your strategy?
- Execution: Is your sales team taking the appropriate actions? For example, if a critical part of the strategy is to sell a new product or solution, is this getting done?
- Perception: Do your sales reps believe they have what they need to be successful? Is the organization behind them, equipping them with the capabilities, skills, messages and technologies necessary to deliver on their goals?
- Results: Is the organization delivering what is expected? Is it meeting its objectives?
Do you know the utilization of your sales force? To find out, begin by taking an inventory of how you measure the five categories of utilization. Maybe you’ve established a comprehensive dashboard and already measure and manage against each category effectively. Most likely there are some areas not being measured today with room for improvement. Once you prioritize the areas of measurement to focus on, it’s time to benchmark the results – both internally and externally – and identify performance gaps so you can put an action plan in place to ensure you make next year’s numbers.
Want to make sure your sales force is fully utilized? Contact us to today to learn how Alexander Group can help.
Learn more by visiting Sales Analytics.