Measuring Recurring Revenue Growth

Market values prioritize growth over EBITA with recurring models.
So, how do recurring revenue companies measure and compensate their sellers on growth?
Growth Measure Options
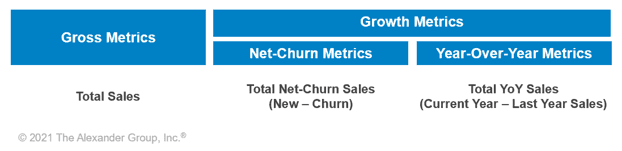
Companies can use either gross or growth metrics in their sales compensation plans. Gross metrics measure the total value while growth metrics measure the incremental value. There are two typical growth metric calculations companies use—net-churn and year-over-year. Regardless of the measure/calculation type, there are multiple measure options based on a jobs Land, Expand and/or Renewal focus.
I. Gross Metrics
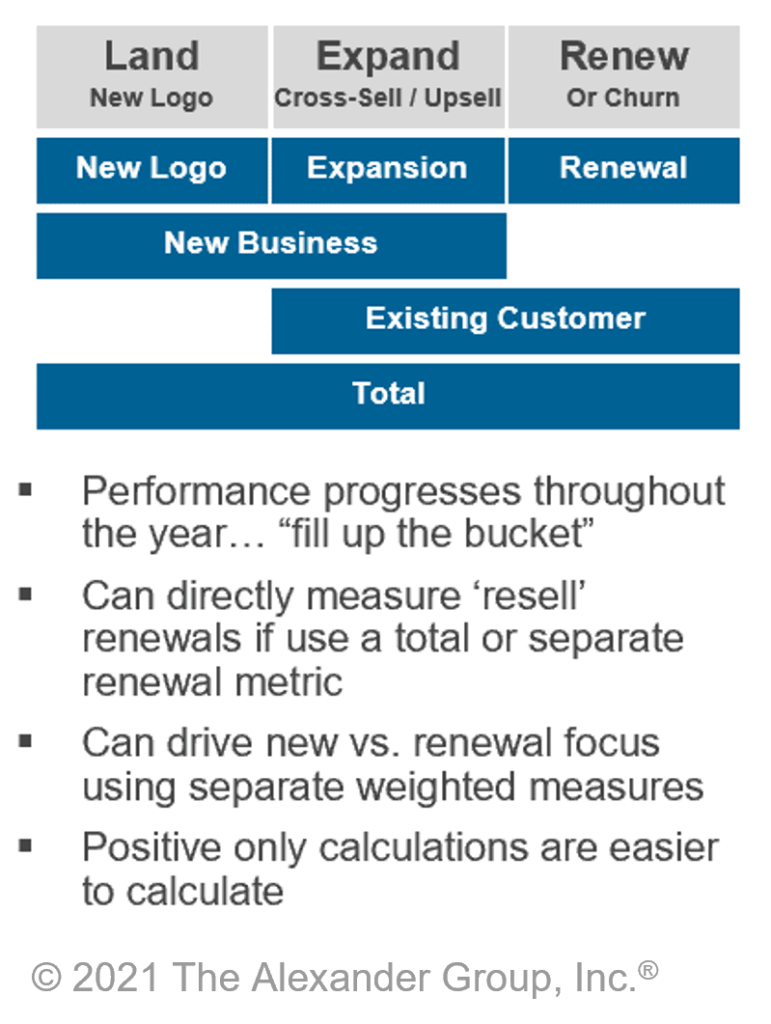
Gross metrics are positive only calculations that “fill up a seller’s bucket.” Although they are not technically ‘growth’ metrics, companies typically set bigger quotas aligned to a territory’s growth potential. Gross metric options include new logo, expansion, renewal and all the combinations thereof (see table below). Gross metrics are simple to calculate and easy to understand. They are the most common metric used in sales compensation plans.
Gross Metric Options
II. Growth Net-Churn Metrics
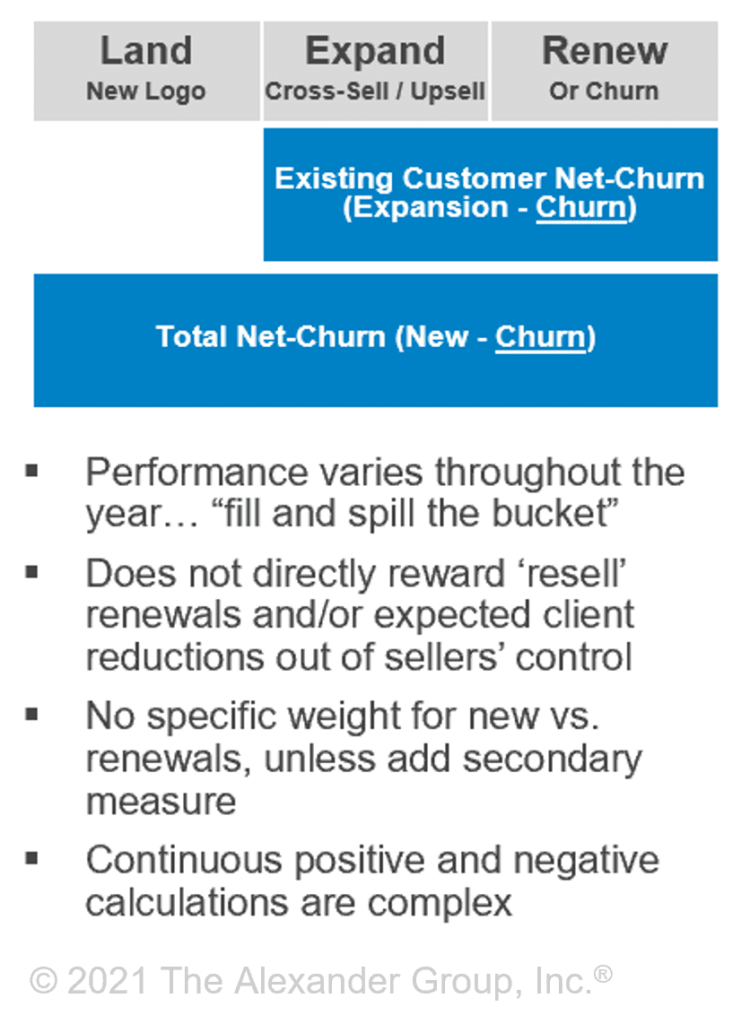
Growth net-churn metrics include ongoing positive and negative calculations that both “fill and spill the seller’s bucket.” These metrics focus the seller on driving new business while keeping them accountable for any churn. These metrics are more complicated to administer, track and communicate. They also do not directly reward a seller for any difficult ‘resell’ renewals and/or expected reductions outside of a seller’s control. Growth net-churn metrics include new business or existing customer business minus churn including cancelations and downgrades. While enticing, this metric is not used often due to high performance fluctuations, negative calculations and administrative complexity.
Growth Net-Churn Metric Options
III. Growth Year-Over-Year Metrics
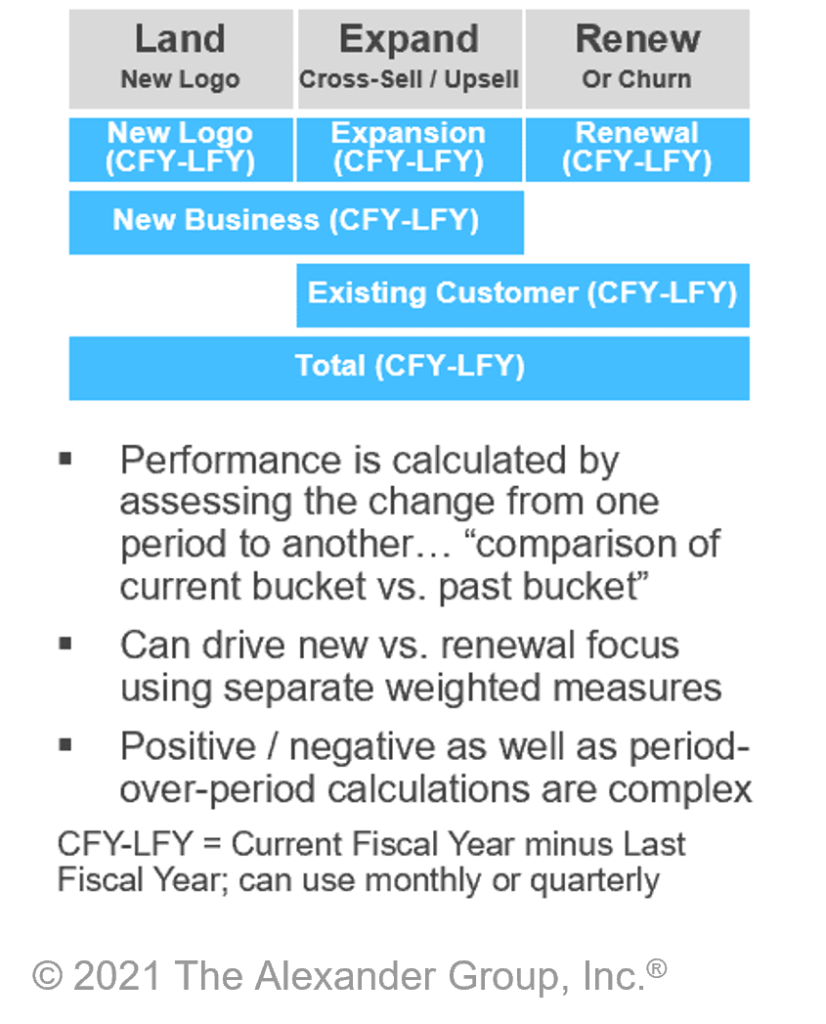
Growth year-over-year (or quarter-over-quarter or month-over-month) metrics compare two period’s performance and must be calculated at the end of the later period. These metrics focus the seller on driving growth over a specified period. These metrics are generally positive calculations; however, they can be negative when there is no growth. Growth year-over-year metrics include new logo, expansion, renewal and all the combinations thereof (see table below). Growth year-over-year metrics rely on accurate period over period comparisons and therefore are not used often either.
Growth Year-Over-Year- Metrics
Calculation Examples
The following waterfall graphic includes the new logo, expand, renewal and churn ACV dollars for a seller over a two-year period.
Year 1 and Year 2 ACV Sales
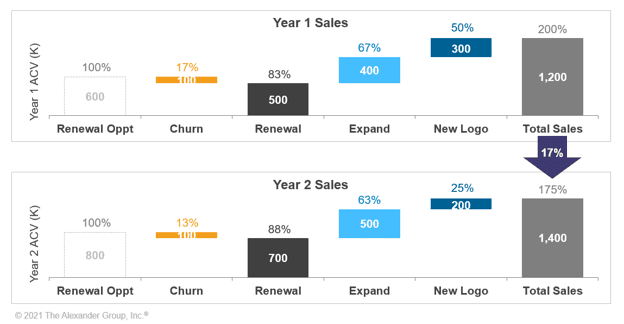
Gross Metric Calculation
- Year 2 New Gross Sales: 700k (500 Expand + 200 New Logo)
- Year 2 Total Gross Sales: 1,400k (700 Renewal + 500 Expand + 200 New Logo)
Growth Net-Churn Metric Calculation
- Year 2 Existing Customer Growth Net-Churn Sales: 400k (500 Expand – 100 Churn)
- Year 2 Total Growth Net-Churn Sales: 600k (500 Expand + 200 New Logo – 100 Churn)
Growth Year-Over-Year Metrics
- Year 2 Total Growth Year-over-Year Sales: 200k (1,400 Year 2 Total – 1,200 Year 1 Total)
Comments on NRR and GRR Measures
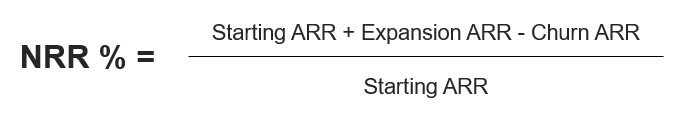
There are two other measures that companies use to measure growth success – Net Revenue Retention (NRR) and Gross Revenue Retention (GRR). Some people may confuse NRR with Growth Net-Churn Metrics listed above. For this reason, we want to clarify that NRR (and its companion metric GRR) are rate (%) metrics and are business metrics typically used to measure expansion and renewal health. They both use starting Annual Recurring Revenue (ARR) – or monthly recurring revenue – which includes all recurring revenue business for the last year (or month) regardless of when it was sold. In other words, it is different than last year’s (or month’s) contracts sold.
- Net Revenue Retention Rate (NRR %): % of recurring revenue retained from existing customers in a defined time period, including expansion revenue, downgrades and cancelations. This metric gives a comprehensive view of positive as well as negative changes with respect to customer retention.
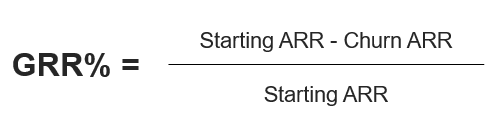
- Gross Revenue Retention Rate (GRR %): % of recurring revenue retained from existing customers in a defined time period, including downgrades and cancelations, but not expansion. This metric highlights only negative change with respect to customer retention.
Alexander Group Guidance
If you are wrestling with how best to measure your sales team’s growth or any other challenges, contact us today to schedule a complimentary one-hour session with one our technology practice leaders.
___________________________________________________
Recommended Insights:
Growing Revenue Through Effectively Evaluating Churn