Rule of 40–Account Prioritization and Segmentation

As XaaS companies prepare for their annual go-to-market (GTM) planning, Rule of 40 is increasingly driving the need to think about the impact on operational decision-making. In Rule of 40 – Implications for Fiscal Year Go-to-Market Planning, we outlined the four scenarios XaaS companies could find themselves in as well as how Rule of 40 impacts GTM planning across these areas. This article is specific to Account prioritization and Segmentation needs for each scenario.
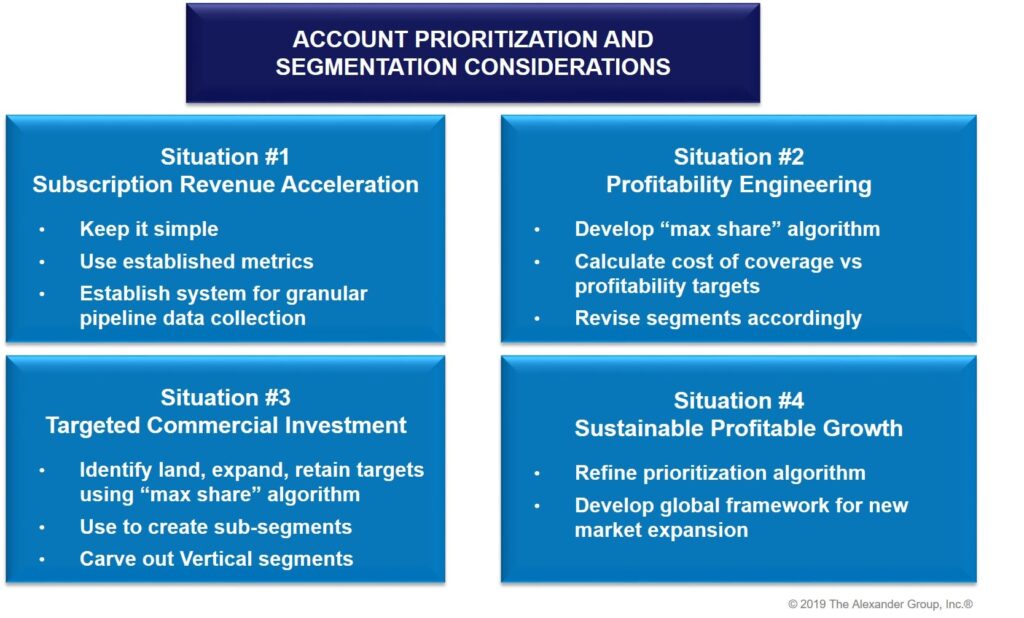
Scenario 1: Subscription Revenue Acceleration
For companies in Scenario #1, the segmentation model should point sellers in the right direction, but it does not yet need to incorporate detailed prioritization guidance. The focus in Scenario #1 should be on highly competitive sales compensation plans that can attract and retain top talent. Therefore, a company’s primary goal of segmentation is to not underutilize this top talent. To achieve this, create unrestrictive segments that allow resources to self-identify the best opportunities, which also ensures they do not spend the majority of their time on easy, but low value opportunities. Most successful companies in this phase have a relatively simple model (e.g., Enterprise, Commercial, SMB) and set a high bar for the Enterprise segment where the most expensive resources sit. Enterprise should include high-potential new logos or subscription conversion targets based on simple metrics like Total Company Revenue or Number of Employees. The major pitfall to avoid is overly generic “greenfield” territories that provide zero restrictions on account activity. Even if a segment is undercovered, it’s important to push talented resources toward high potential opportunities.
At the same time, avoid overcomplicated or unintuitive segmentation schemes. At this stage, it is unlikely a company has enough data or history to begin prioritizing ostensibly smaller opportunities based on customer criteria. However, the most important step a company can take in this phase is to begin collecting data for account prioritization later on. For example, they can put in place CRM-entry protocol on key data points such as use-cases, organizational characteristics and competitive situations. When the time comes, the company can combine this data with pipeline and third-party data for more precise prioritization.
Scenario 2: Profitability Engineering
In Scenario #2, sales jobs have proliferated and companies are relying on process-specific or technical overlays. In this Scenario, it is now more critical to segment based on the revenue potential of your customers due to the additional resources covering key accounts. The best way to begin this process is to create a revenue algorithm using the concept of maximum share (i.e., “what do our best accounts produce and look like?”). Through a mix of manual and data-based efforts, companies can typically identify these customers. When mapped against key characteristics and potential use-cases, trends emerge as to what defines a healthy opportunity. Common attributes include customer vertical, current tech infrastructure, current solution, growth stage and degree of centralization. When applied against the best current customers, a predictive revenue algorithm emerges. The projections can then be used to re-shuffle accounts and re-define segments.
The primary pitfall to avoid at this stage is over-rotating toward the algorithm’s results. While an algorithm begins to provide insights beyond the face-value metrics like Number of Employees, it shouldn’t yet be used as the primary driver of segmentation. Instead, take a “core metric + exceptions” approach. Maintain the segmentation model from Phase 1 that is based on more intuitive metrics, and begin to refine the high and low ends of each segment. For example, if the algorithm is showing that 20% – 30% of accounts in Commercial are higher opportunities than Enterprise, consider using one of the key characteristics to shift 5% – 10% of accounts into Enterprise from Commercial and vise-versa. This will downgrade lower opportunity accounts into lower-cost coverage and increase focus on high potential accounts that otherwise may remain underserved.
Companies can also use the algorithm to realign coverage segments based on profitability targets. Companies do this by calculating average cost of coverage for an account in each segment (including overlay roles) and comparing to current and potential spend based on the predictive algorithm. This can help refine coverage ratios by highlighting where potential revenue does not justify intensity of coverage.
Scenario 3: Targeted Commercial Investment
In Scenario 3, companies now begin to introduce more segments, as well as sub-segments. Based on coverage and profitability objectives, companies may now require between four to six segments to tailor coverage models (and costs) appropriately. This includes horizontal segments based on overall opportunity size, as well as vertical segments where it has become clear that a specialized sales process is required (e.g., Government, Financial Services, etc.).
Companies can also create sub-segments within the broader segments by leveraging a more refined algorithm and incorporating required revenue motions, such as land, expand or retain. While the overall coverage model might technically be the same for all accounts in a given segment, sub-segmentation allows for clearer goal setting and provides guidance as to where sellers should spend time within the assigned accounts. The revenue-potential algorithm is still the primary tool to achieve this. Based on a matrix of opportunity versus current spend, each customer should carry a designation:
- High-priority land or expansion customer (not yet landed or below 25% of total opportunity)
- Medium-priority expansion customer (between 25% – 50% of total opportunity)
- Retention customer (>50% of opportunity captured)
While greater than 50% of opportunity may seem like a low bar for “retention,” keep in mind that most customers at best will achieve between 75% – 80% of projected opportunity depending on algorithm methodology. Regardless of detailed construction, this supports the concept of “Target Commercial Investment.” Sub-segmentation models guide sellers to the accounts that carry the most upside for them and their incentives, as well as the company.
Scenario 4: Sustainable Profitable Growth
In Scenario #4, segmentation models typically maintain status quo from an overall structure perspective. However, governance becomes critical in ensuring leaders update account opportunity estimates accurately and leverage them for further coverage refinement. The segmentation model also provides guidance for other investments such as digital tools as companies begin to look for highly targeted, lower cost acquisition expansion opportunities.
Global alignment also becomes a key segmentation decision as newly entered markets may be in Scenario #1, while more mature markets are in Scenario #3 or #4. Create global frameworks to maintain overall consistency across geographies, while tailoring specific segment definitions to local resource cost and opportunity estimates. Companies can also leverage the algorithm design from mature markets to begin prioritization, either before or after launch, to accelerate the time spent in revenue acceleration.
Implications for Revenue Leaders
Account Prioritization and Segmentation provide the foundation for GTM planning. Revenue leaders need balanced, field-driven opportunity identification early on with the transition toward more targeted and profitable coverage as they grow. Companies must continually capture and leverage customer data needs to accelerate this journey. The key is targeting the right segments so the sales team can help drive toward Rule of 40.

Contact Us
Alexander Group’s Technology practice can help get your company on the right path to profitable growth, irrespective of your current state. Contact us today to arrange a briefing on how we can help you design the strategy, structure and management of your commercial organization to maximize your performance and valuation.