The performance gap is widening. Top-quartile are above 130% NRR while bottom-quartile peers fall below 90%, and the median NRR across all private B2B SaaS has compressed to just 101%. The typical SaaS company is barely growing its existing customer base after accounting for churn and contraction.
The Customer Marketing ROI Gap
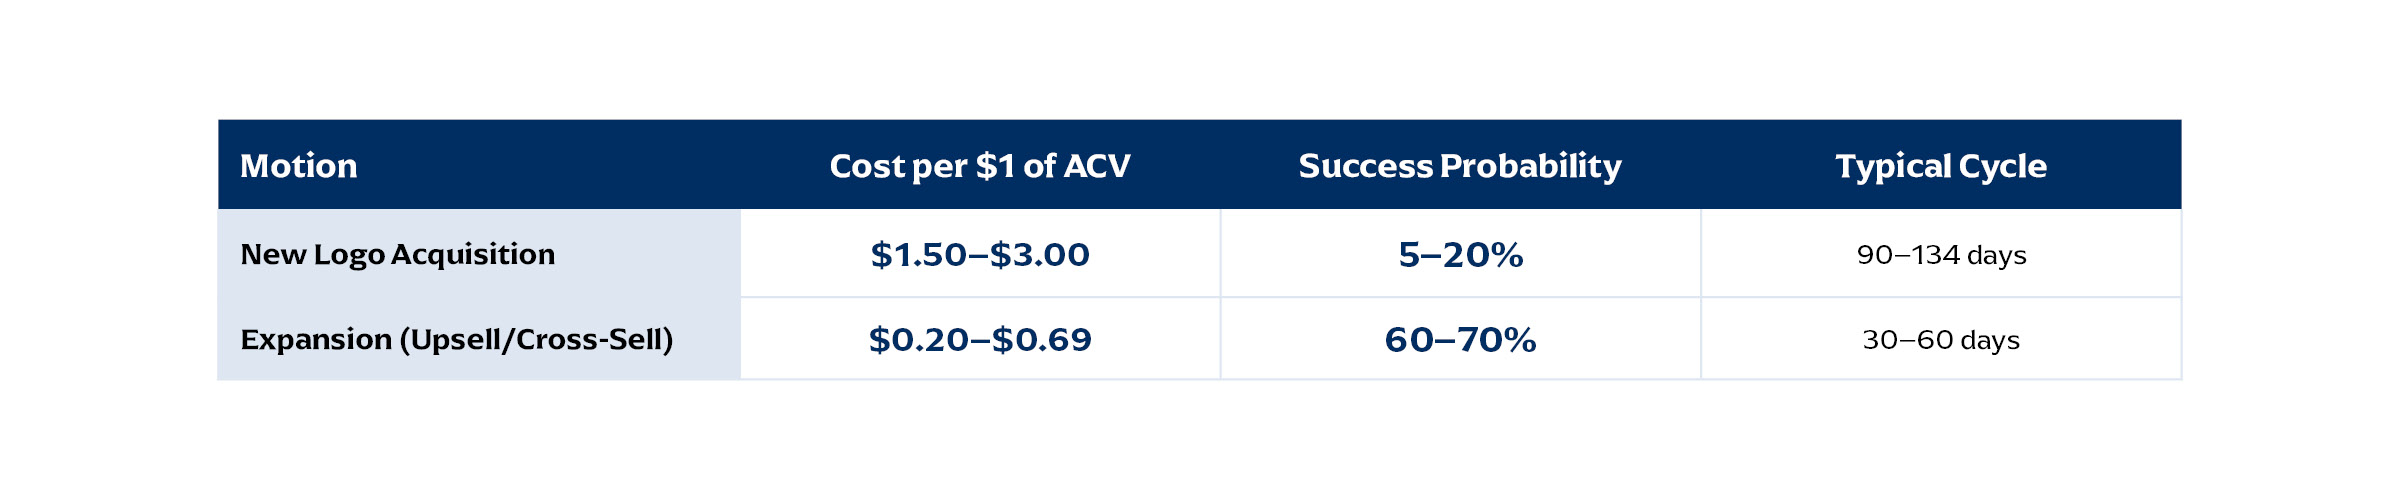
If expansion is 3-10x more capital-efficient than new logo acquisition, why does it get a fraction of the investment?
Organizational inertia. Most B2B marketing organizations were built for a single purpose: to generate new leads. The entire architecture, ranging from demand gen to BDR teams to attribution models to executive dashboards, is oriented around new logo acquisition. Because of this, customer marketing (where it exists) is typically a single person sending renewal reminders and managing a reference program.
As companies shift away from seat-based pricing to consumption or usage-based models, leveraging marketing-driven expansion is critical to prompt new use case expansion and drive ongoing usage.
Alexander Group’s 2026 Marketing Profitability & Commercial ROI Research surveyed 260+ companies across 8 industries and reveals how high-growth organizations are breaking this pattern:
- 58% of high-growth organizations are investing in customer journey architect capabilities, by building dedicated functions that map, measure and optimize the post-sale experience as rigorously as the pre-sale funnel
- 33% are planning for content strategy capabilities, recognizing that expansion requires its own content engine that’s distinct from acquisition-focused demand gen.
- 86% of marketing organizations are driving positive ROMI, with 56% delivering 2x returns or better, but the highest returns are coming from retention and expansion programs, not new logo campaigns.
Alexander Group’s Revenue Ready Marketing Organization Research confirms the shift is accelerating: Nearly half of marketers are adjusting targeting strategies to focus on increasing loyalty of existing customers rather than pursuing new ones, with 60% of budgets now allocated to market penetration strategies selling more to existing customers.
Instead of thinking of this as a temporary rebalancing, leaders should see that this is a structural recognition of the value that post-sales campaigns can bring.
What the GRR Floor Tells You
Before you can expand, you have to retain. This is where many technology companies have a hidden crisis.
GRR, or the percentage of recurring revenue you keep before counting any expansion, is the truest measure of product stickiness and customer health. It strips away the mask that expansion revenue provides. A company can have a healthy-looking NRR at 105% while its GRR sits at 82%, meaning it’s losing nearly a fifth of its base revenue every year, and the expansion team is simply running fast enough to outpace the leaks.
Alexander Group’s XaaS revenue growth benchmark database reveals that median GRR has slipped from 90% to 88% while top-quartile GRR holds steady at 95%. In Alexander Group’s PE diligence work, a GRR below 88% is a consistent red flag. It means the company must replace 12%+ of its revenue base every year before growing, and at $2.00 per new ARR dollar, that replacement cost is devastating to capital efficiency.
The ILAER Framework: Growth Across the Full Customer Lifecycle
Breaking down the ILAER framework (identify, land, adopt, expand, renew) provides the blueprint to shift focus to expansion-first growth.
Most technology companies invest disproportionately in the first two stages (identify and land) and under-invest in the three stages that drive NRR (adopt, expand, renew). However, the highest-performing organizations in our benchmark database treat all five stages as equally strategic.
Stages three through five in the ILAER model (adopt, expand, renew) are where expansion revenue is created, which is why they require dedicated marketing investment, dedicated coverage and dedicated measurement. Companies that continue treating post-sale as a “customer success problem” rather than a “growth marketing opportunity” are leaving their most capital-efficient pipeline on the table.
Five Moves to Unlock the $0.69 Pipeline
Here are the five highest-leverage moves to unlock expansion economics:
1. Rebalance Investment Allocation Deliberately
Stop defaulting to the 80/20 new-logo/expansion split. Companies under $100M in ARR are generating 45% of new ARR from expansion, while that number climbs to 67% for companies over $1B, and your investment should reflect that reality. Start by moving to a 60/40 split, and then measure the CAC impact. Alexander Group’s high-growth cohort shows that the organizations moving fastest are increasing 2026 marketing budgets by 10%+ through strategic reallocation toward customer journey, content strategy and AI capabilities.
2. Build Dedicated Customer Marketing as a First-Class Function
Customer marketing cannot be one person sending renewal emails. Success requires its own pipeline targets, its own campaigns (lifecycle, cross-sell, upsell, advocacy), its own content engine and its own attribution model.
3. Restructure Compensation to Reward Existing Accounts
Variable compensation tied to renewal metrics is trending from around 10 to 20% to 40–60%. This isn’t just a comp design change, it’s a signal to the entire organization about what matters. Behavior changes when leadership bonuses are explicitly tied to GRR/NRR, when Customer Service/Success plus Sales jointly own accountability for churn mitigation and when quarterly “save and expand” campaigns are funded and measured
4. Fix GRR Before Scaling Expansion
If your GRR is below 88%, you have a retention problem that expansion cannot outrun. Fix churn before pursuing expansion. That means product/customer service/success review, onboarding optimization (43% of SMB customer losses occur in the first 90 days) and value realization programs that quantify ROI for customers before they reach the renewal decision point. Product usage declines by an average of 41% in the quarter preceding cancellation: that’s a 90-day warning window that most companies don’t instrument.
5. Deploy AI for Expansion Intelligence
Alexander Group research shows that 55% of high-growth organizations are already using AI for lead scoring and predictive analytics. The same AI capabilities that improve acquisition efficiency—health scoring, propensity modeling, next-best-offer recommendations, predictive churn detection—are even more powerful when applied to existing customers, because you have vastly more behavioral data to train on.
The Compounding Advantage: Why This Matters More Every Quarter
Here’s what makes expansion economics truly transformative: they compound.
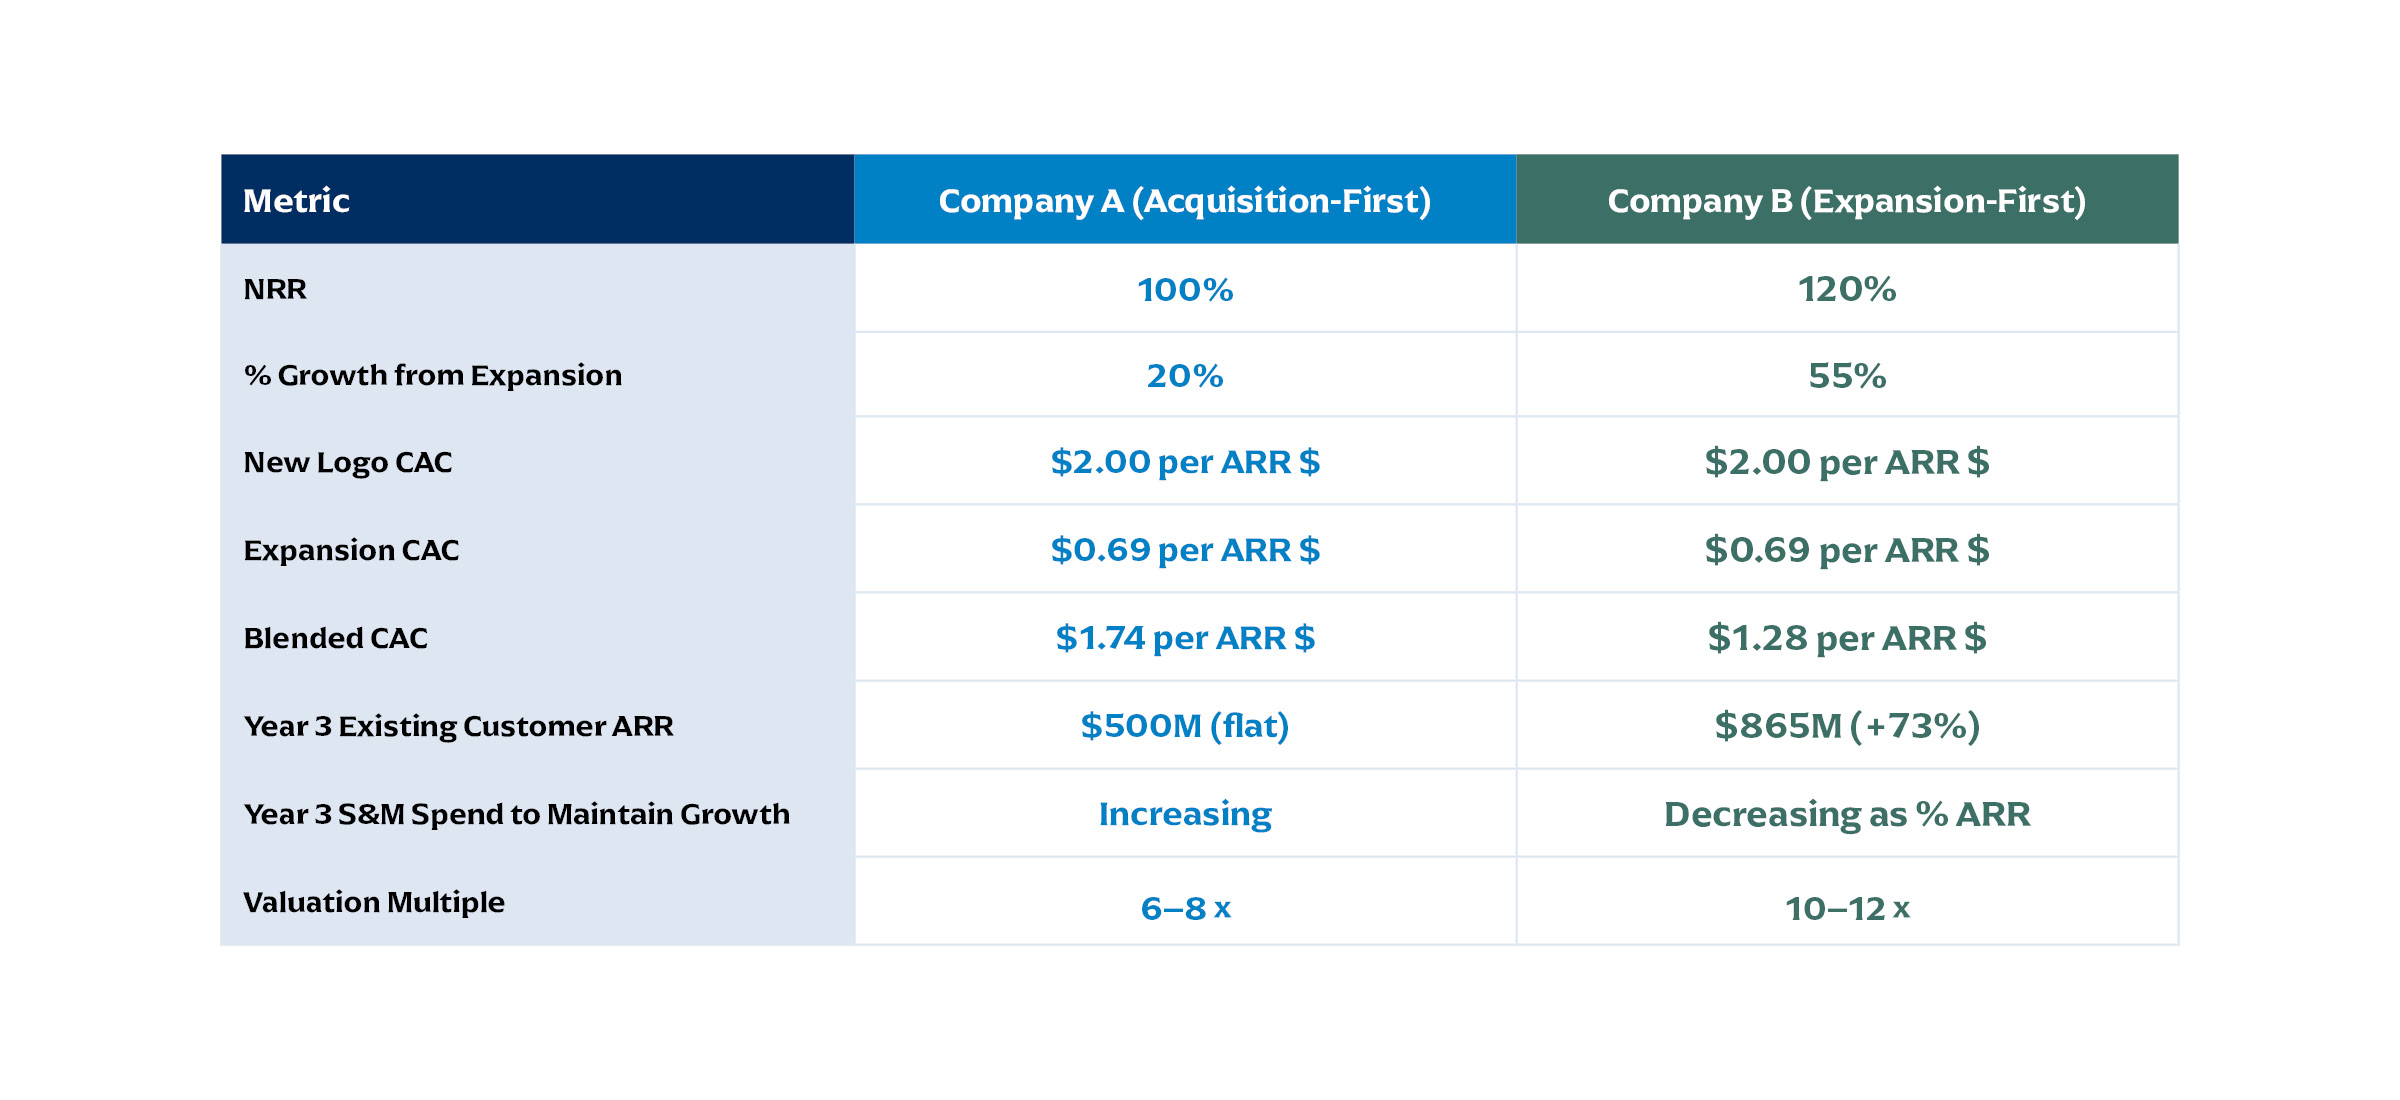
Consider two companies, both at $500M in ARR, both growing at 25% annually: