This is where effective human touchpoint mapping comes into play.
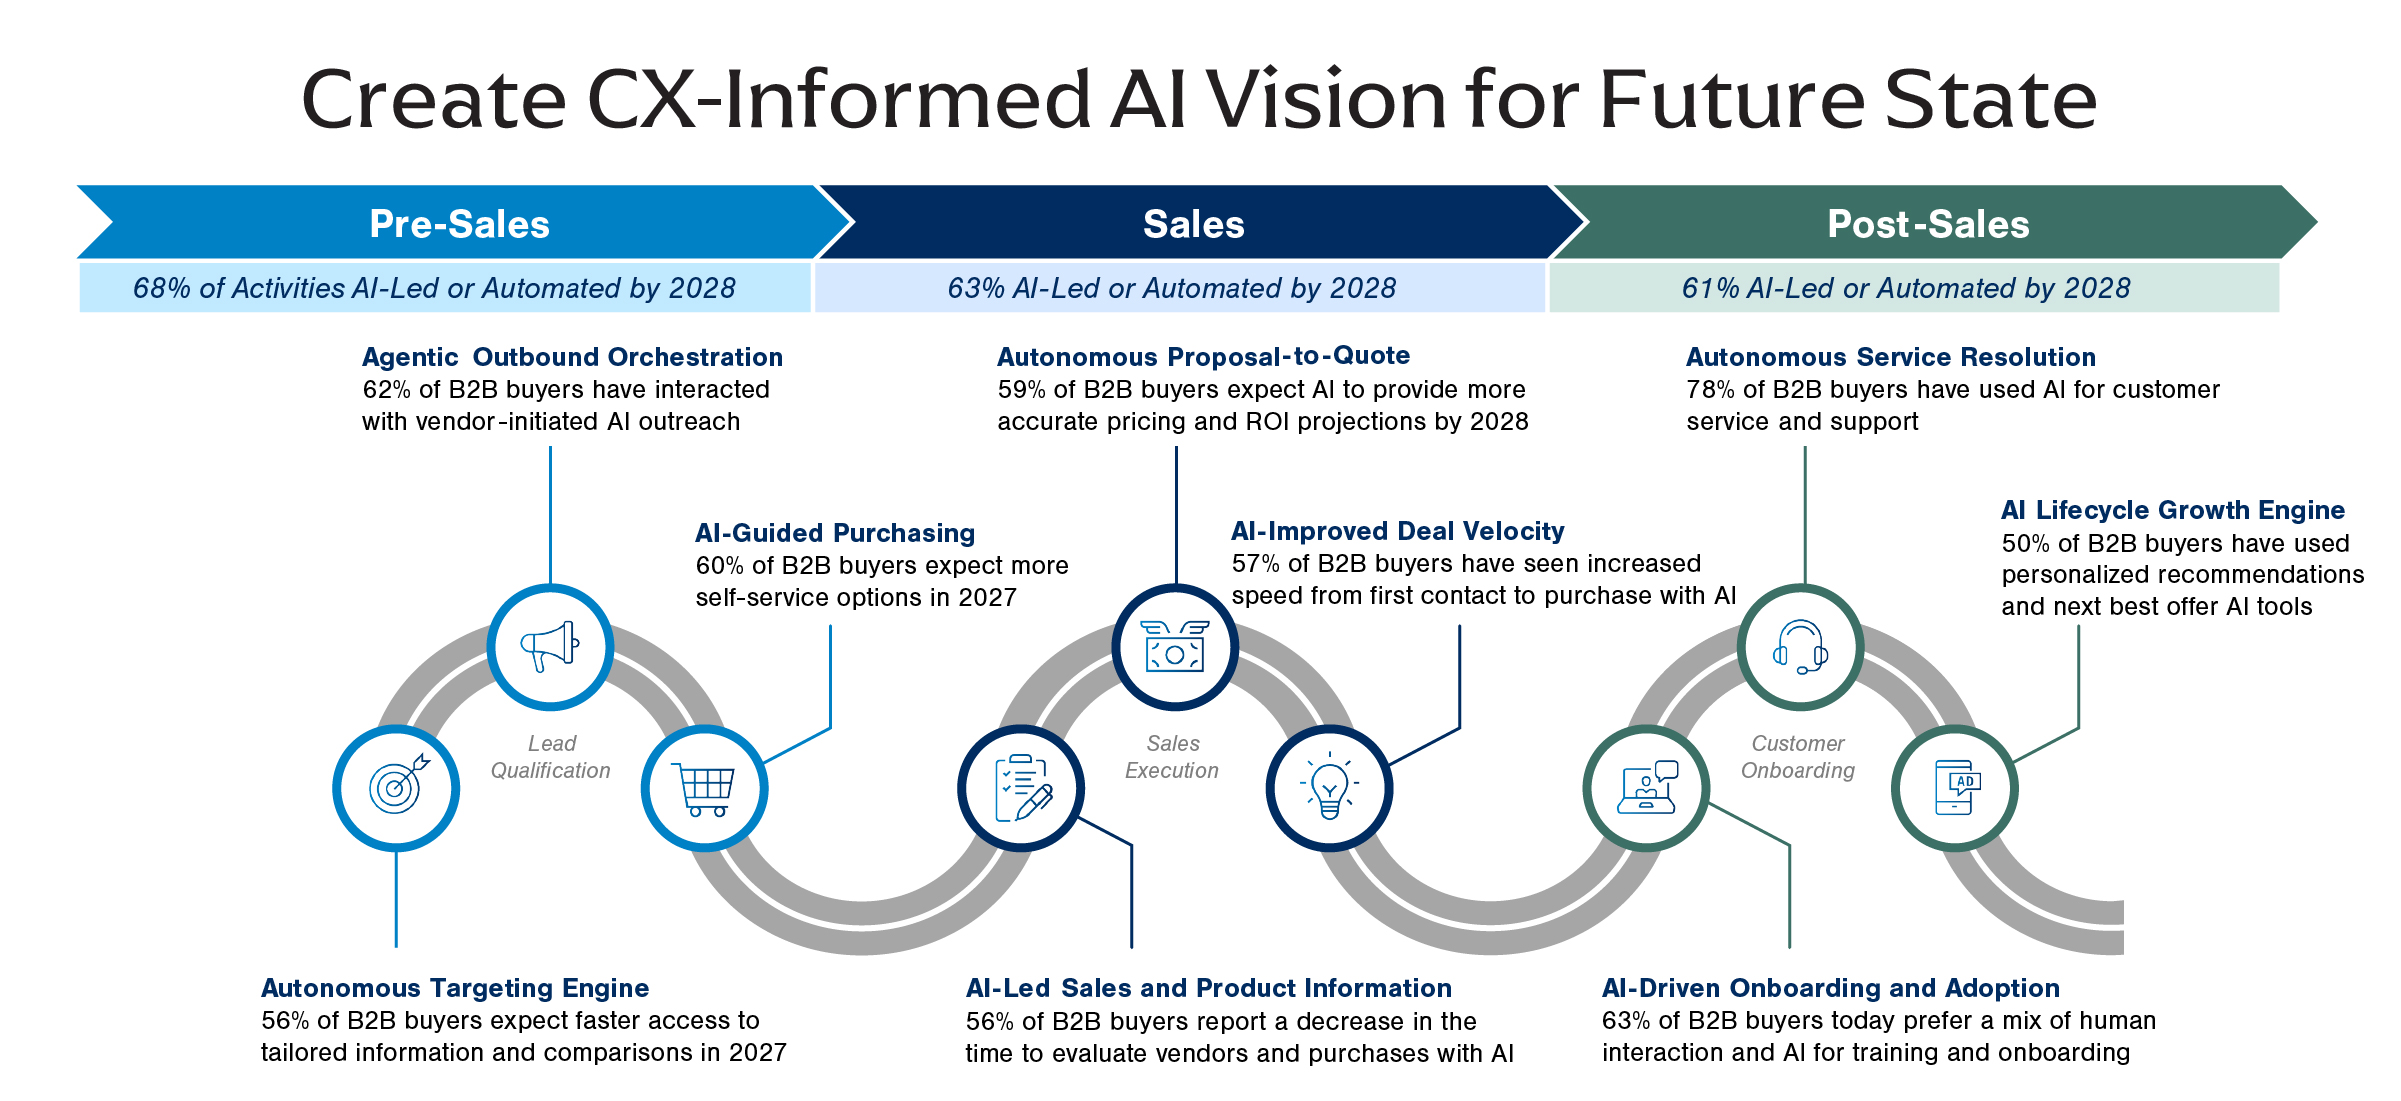
Leading organizations determine where AI should be deployed by assessing each step of the process through two lenses: AI risk and relationship value. Activities with higher AI risk are more likely to result in negative outcomes if automated, while activities with higher relationship value require human involvement to build trust, manage relationships and drive successful outcomes.
After classifying each step in a workflow based on this framework, top organizations then identify and assign the right level of human involvement before deploying any use case— focusing first on the steps with low risk and low relationship value. As a result, AI is layered into the sales cycle where it drives real value for both customers and sellers, while human involvement is still used in the critical moments that AI cannot or should not handle.
AI Benefits Start with the Workflow
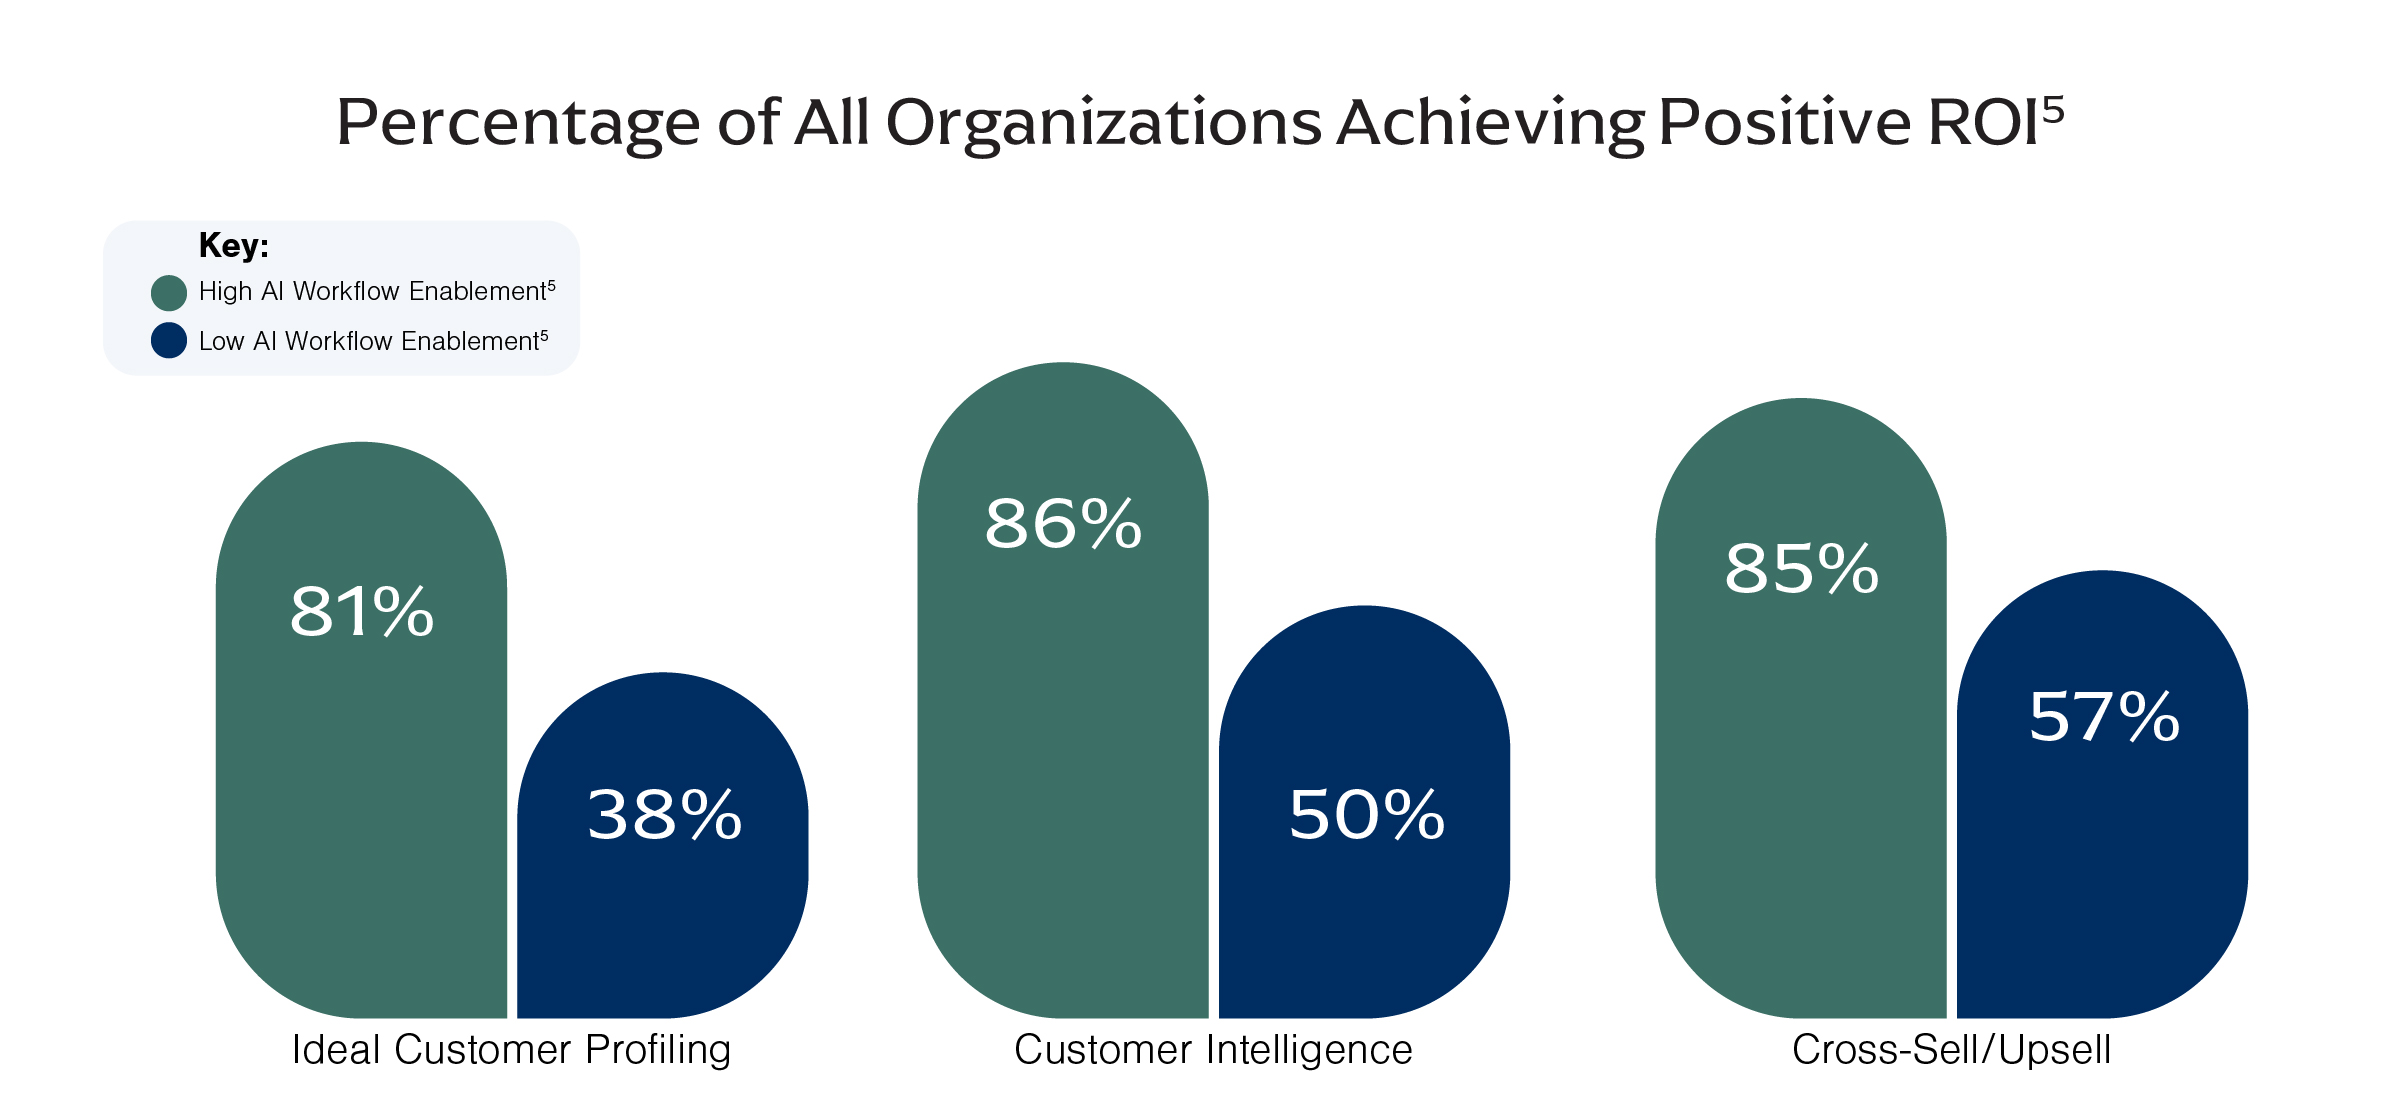
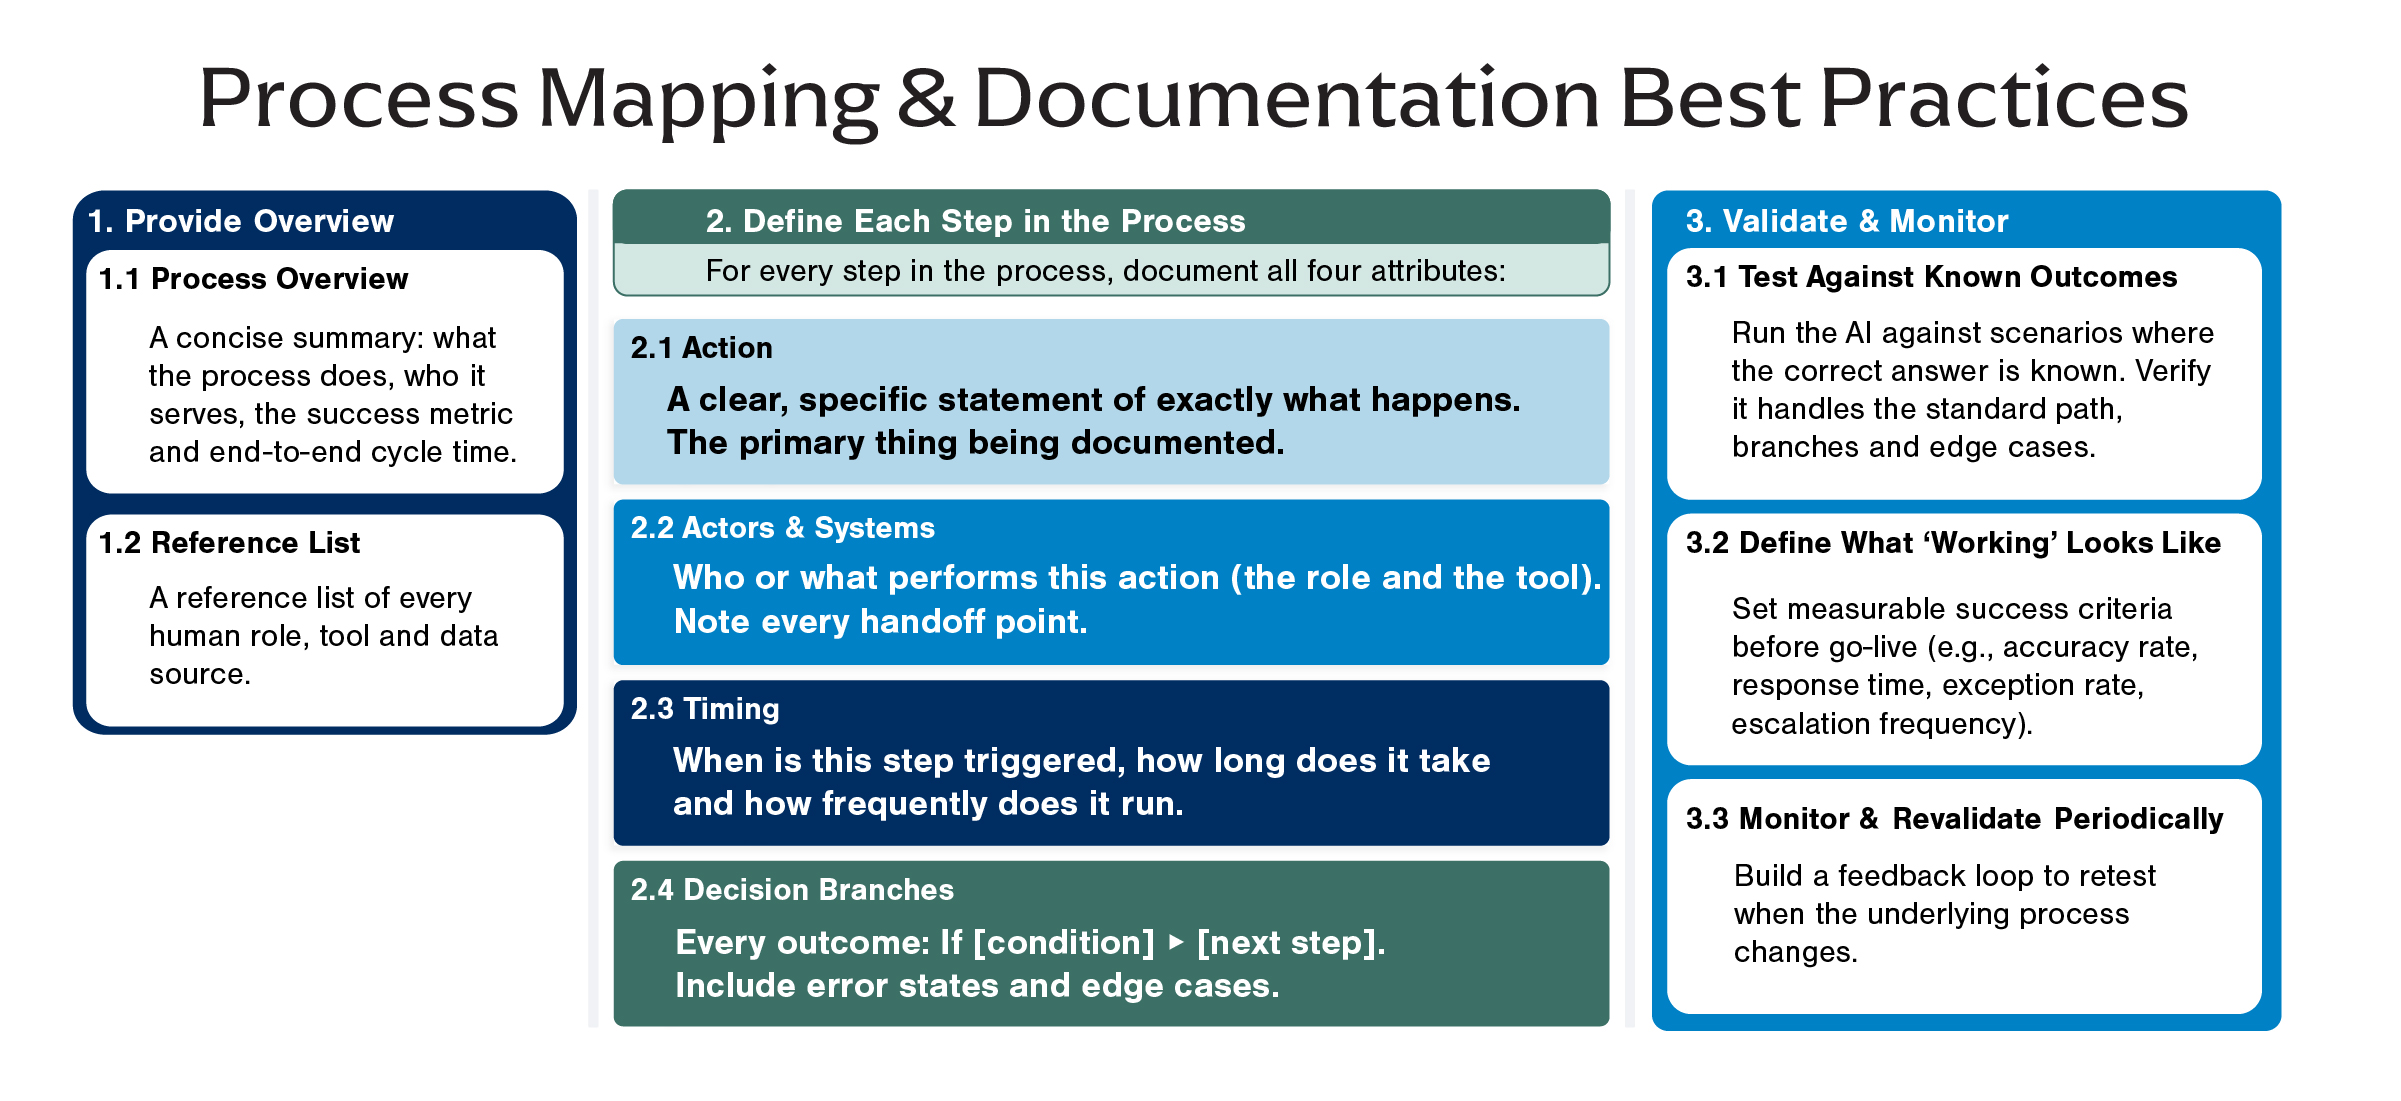
As organizational AI investments continue to rise, understanding the GTM drivers of use case success becomes more critical. Although AI can provide advanced technological capabilities, organizations will achieve sustainable ROI when AI becomes properly embedded within repeatable, documented and collaborative workflows.
While organizations continue to scale AI adoption, one of the greatest opportunities to drive success is to create the organizational infrastructure that allows those tools to be used consistently and effectively.
[1] Source: Alexander Group Revenue Growth Benchmark Database.
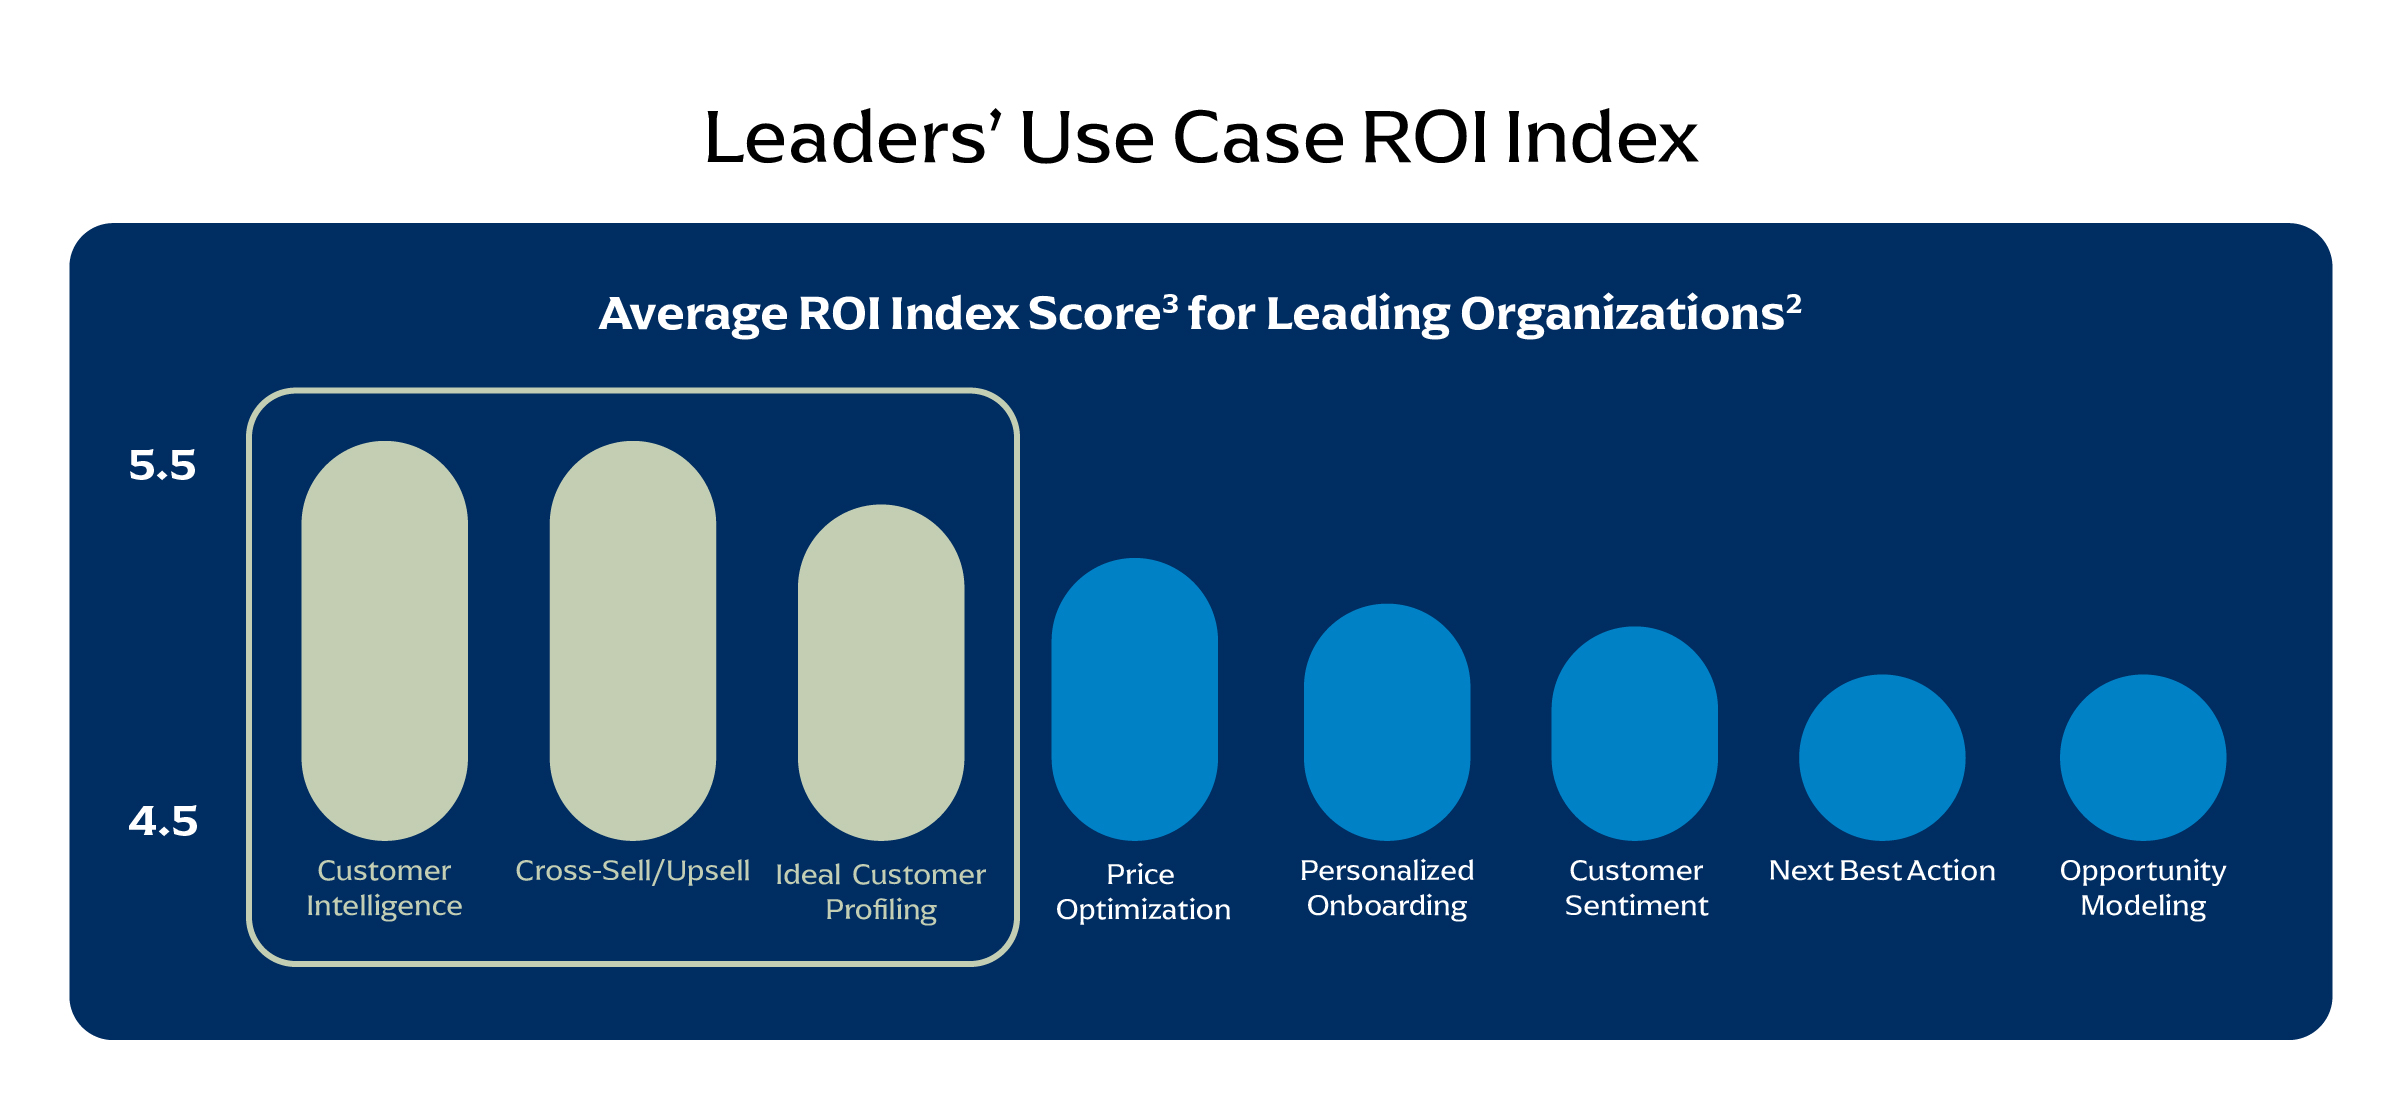
[2] Alexander Group 2026 Go-to-Market AI Transformation research defined “Leaders” as organizations achieving positive ROI on 50%+ of deployed use cases, above‑industry-median revenue growth and above‑industry-median commercial AI investment as a percentage of S&M Expense.
[3] ROI Index Score reflects Leaders’ return on investment rating for each AI use case, measured on a 7-point sentiment scale. Scores reflect the average response among organizations actively using each use case.
[4] Logistic regression odds average calculated by running individual logistic regressions for each AI enablement activity and then averaging the odds across all three.
[5] Low Enablement defined as scoring 3 or below on a 7-point effectiveness scale; High Enablement defined as scoring 6+ on a 7-point effectiveness scale; positive ROI defined as scoring 5+ on a 7-point sentiment scale.