Sales Investment Planning: The Risk of E/R
“How much should I invest in my sales organization?” is one of the more frequent questions we hear from senior leaders. In their search for answers, CEOs, CFOs and heads of sales will often ask us about the ratio of sales costs to revenue (E/R). It makes sense. E/R is straightforward: For every dollar of revenue, we spend X percent on sales. E/R is consistent: It can be applied across industries and geographies. And E/R is revenue-neutral: Companies both large and small can be compared using a common metric. For directional guidance and benchmarking, a standard E/R provides useful insights; but it is a less-than-perfect measure for building next year’s investment plan.
The biggest issue with using E/R as a planning tool is that while it compares sales investment relative to a revenue figure, it is not a predictor of sales performance. Companies with a higher E/R (i.e., higher level of investment) don’t necessarily grow faster than companies with a lower ratio.
Like any ratio, sales cost E/R is calculated using a numerator and a denominator. As a result, high sales cost E/R can come from either high sales cost dollars or low revenue. These are two distinct scenarios, potentially requiring very different courses of action.
As an example, let’s take a mid-size enterprise software company, which we’ll call GrowMore Software, getting ready to build its 2015 plan. GrowMore averages $1.5MM in revenue per salesperson. Based on Alexander Group’s sales benchmarking database, the median all-in sales cost E/R for enterprise software companies is 25%. Using that data, GrowMore’s executive team allocates 25% of revenue ($375k per rep) to sales for the upcoming year. Is that the right level of investment to ensure GrowMore maximizes the odds of meeting its plan?
Intuitively it makes sense that (up to a point) the more a company invests, the more it should grow. But what we observe in practice is quite different.
The table below shows the average growth rates for software organizations above and below the 25% E/R benchmark.
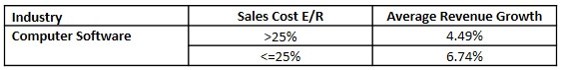
What we observe in the data is that companies with sales cost E/R higher than the median (i.e., greater than 25%) have widely divergent growth rates. In fact, there is almost no correlation between E/R and revenue growth. There are many companies that have high E/R and low or negative growth rates, dragging down the E/R average.
But what happens if we change the methodology and look at those same software companies on a dollar-per-rep basis? We find that those companies with E/R >25% and low growth rates share two important characteristics:
- Lower revenue per rep than the median
- Lower investment per rep than the median
These companies are struggling with slow growth or declining revenues. They may not be in a position to aggressively invest in sales, but their lower overall revenue drives a higher overall E/R.
Looking at the results through the lens of $/rep provides a much clearer picture of what’s happening. It eliminates the distortion caused by low revenue results. Companies with a high E/R on a $/rep basis are consciously investing in the sales function, more often resulting in high revenue and high growth.
Further, Alexander Group’s data show that, everything else being equal, companies that invest in higher-than-median sales cost $/rep are almost twice as likely to have higher-than-median revenue $/rep than companies that do not. Even if those higher revenues do not materialize immediately, a higher-than-median investment in sales produces a higher average growth rate over time: 16% vs. 6% for those below the median sales cost $/rep.
An important conclusion from this analysis is that when it comes to revenue and investment planning, a more appropriate measure is sales cost and revenue on a dollar-per-rep basis ($/rep).
And how about GrowMore Software? GrowMore has average revenue per rep of $1.5MM and established an initial investment plan of $375k per salesperson. The software industry benchmarks for revenue and sales costs per rep are $2.1MM and $546k, respectively. If we compare GrowMore with the benchmarks, we find some compelling gaps:
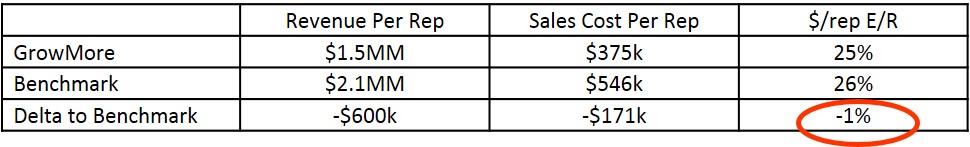
While the revenue per rep and sales cost per rep numbers are initially more eye-catching, it’s the 1% gap that should worry GrowMore’s leadership. Based on the benchmarks, GrowMore would arguably underfund its sales organization by $15,000 per rep (26% * $1.5MM). With GrowMore having 500 salespeople, that’s a $7.5MM gap! Armed with this important new data, GrowMore has decided to go back through the planning process to evaluate the important trade-offs associated with an increased investment in sales.
Want to compare your company’s $/rep, or is it time to start thinking about next year? Learn more about Alexander Group’s Sales Analytics.