What Do Sales Leaders Say Is Their #1 Challenge? Setting Quotas

Sales leaders want to achieve goals, but what are the challenges?
According to a recent Alexander Group survey, 61% of sales leaders say it is setting quotas. Surprisingly, most sales leaders spend very little time devoted to this exercise. Have they simply accepted the top down number and the “peanut butter” approach of spreading next year’s growth expectations across their teams? Based on our experience, the exercise of analyzing previous year’s quota performance data is often minimal; and the effort to develop and apply sound methodologies for setting and allocating quotas, often overlooked. However, careful analysis of previous quota performance distributions can yield a wide range of findings and insights. Not only does it shed light on what future distributions may look like, but it may also shed light on a variety of sales force issues. A normal, bell-shaped quota distribution is critical to maintaining a well-motivated and cost effective sales force. If attainment distributions are not balanced, undesirable results ensue such as low morale, increased turnover and needless under- or over-incentive payments, and a general failure to create an appropriate risk/reward environment.
Why Is Quota Setting Such a Challenge?
And what causes skewed attainment distributions? Here are some of the prevalent reasons:
- Top-down corporate approach with little to no bottom-up sales force collaboration
- Peanut butter approach: “Let’s take last year’s performance, add 10% across the territories”
- Procrastination: late process results in a rush job and quotas released well after the new year begins
- Over-allocations driven by unrealistic corporate expectations
- Complex sales crediting rules (rampant double crediting)
- Emotions: fear of losing talent leads to favoritism to top performers
- Poor insight into market potential, etc.
 What is a “good” quota distribution?

Quota distributions should be a balanced and normally distributed mix of sales rep winners (those who achieved some level of outstanding pay beyond 100% of goal) and those who are less than 100% of goal. Typically ~60% of reps should achieve 100% of their goal or greater, and ~40% will achieve less than goal. See below. Sales organizations should strive for consistently achieving this balance globally, within geographic regions, within job roles and on an annual basis.
A Fact-Based Approach
The good news is that taking a fact-based approach to analyzing previous quota distributions is not so difficult. As a rule of thumb use at least 3 years of performance data. Create a histogram with buckets for every 10 points of attainment. The results can be very sobering. What does it say about the organization’s ability to set goals and allocating quotas into territories? Quota programs and the forecast processes that global and regional personnel follow year over year don’t typically change, causing attainments to become more and more skewed over time. Good quota programs involve three things: 1) an appropriate quota methodology (such as modified fair-share), 2) a well-defined process (such as a combined bottom-up, top-down approach), and 3) a tool or system that can effectively track and manage quotas.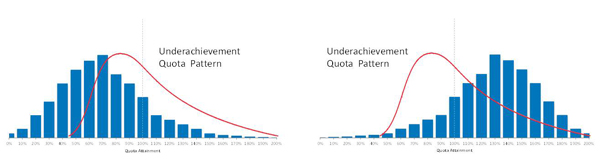
Digging Deeper
Skewed attainment curves, or worse, a bi-modal curve, could indicate issues beyond quota setting. Complete quota program assessments involve deeper review of sales performance, sales process analytics, role clarity, account targeting, and compensation and crediting rules, among other things. There may be many contributing factors. Nonetheless, root causes of recurring skewed patterns of attainment can be rectified. A comprehensive assessment can determine what areas to address. Best in class sales organizations are continually inspecting and improving their methods in order to stretch and grow for optimal performance.

Learn More
To learn more about how to assess and redesign your quota programs, please visit Alexander Group's quota practice or contact us today!