Linked Formula Design
At the core of a sales compensation plan is a formula. A sales compensation formula converts sales performance into pay. A simple sales compensation formula rewards one measure: sales results.
But sales compensation designers often need to build incentive plans with multiple components rewarding different business objectives. For example, one component would reward total sales performance, while a second component might reward product mix, profit or new account sales. While each component is valuable, sellers could achieve high performance on one measure and less than sterling performance on a second measure. Unfortunately, this outcome does not reflect desired “balance” performance. This is when sales compensation designers should consider linked formula designs…but carefully.
Sales Compensation Formulas
Popular formula types include commission, bonus, individual commission rate, scorecard and bonus flip to a commission. Does this sound like gobbledygook? Don’t be alarmed. It’s hard to keep track of all the options considering there are more than 40 formula types. In practical terms, you do not need to consider all these formulas. Revenue management’s objectives and the selling roles help identify the best incentive formulas. For example, a B2B start-up sales team might use a commission formula paying incentives on all sales from dollar one. The more sold, the more paid. The incentive payouts are exactly proportional to sales production. The “market makers” among the sellers will be highly rewarded for securing much needed revenue.
In another situation, sales leaders might want to reward sellers the same pay for achieving 100% of quota even though the actual revenue opportunity/production varies by territory. Account managers overseeing an existing book of business would be such an example. Sales management configures territory size to balance sales efforts; however, actual territory revenue might vary substantially. In this instance, sales management would use a bonus formula—incentive payments tied to percent quota achievement. A seller with a quota of $2.5M would be paid the same as a seller with a $3M quota if both achieved 100% of their assigned objective. This formula approach ensures management rewards comparable efforts and outcomes alike, even if the base of business is substantially different.
Multiple Objectives
What occurs when sales management seeks to reward different and sometimes competing objectives? Consider the incentive plan with two components: one for sales volume and the second for sales profitability. The first measure rewards total sales. The second measure rewards profitability for sustaining better prices. In this case, what should the seller do? Secure lots of volume by allowing prices to drift lower? Or secure more profit dollars by keeping prices high, but potentially suppressing sales volume? An unlinked incentive design featuring two stand-alone components would leave sales personnel with a conundrum: Discount to sell more or sustain pricing and sell less. Management will state, “We want higher volume without discounting.” However, the incentive plan with its two unlinked components does not make this clear. As now designed with two unlinked components, the incentive plan allows sellers to potentially achieve substantial earnings on one measure at the expense of the second measure.
Hurdles/Gates, Multipliers, Matrices: What Are Linked Design Formulas?
As suggested, a linked formula design mathematically connects two measures rewarding balance performance. Success on one measure alone does not provide exceptional incentive earnings, which success on both measures provides. In fact, linked formula designs often feature a penalty for only achieving one measure and performing poorly on a second measure. This makes the linked design more powerful than two standalone measures. Formula linkage encourages balanced performance: “You must perform well on both measures to earn the best payout. Poor performance on the second measure will negatively affect the earnings of the first measure.”
The three most prominent linked formula designs are hurdles/gates, multipliers and matrices. Let’s keep it simple for explanation purposes. We will feature two measures: revenue (sales) and profit. Typical profit measures include gross margin percent, gross margin dollars and price realization. For our examples, we will use gross margin percent and simplified formulas to better illustrate the concepts.
Hurdles/Gates. As the name implies, hurdles/gates set up a performance requirement that affects incentive payments. Let’s apply a hurdle/gate for profitability. Here is a formula example using a hurdle/gate: gross profit margin percent.
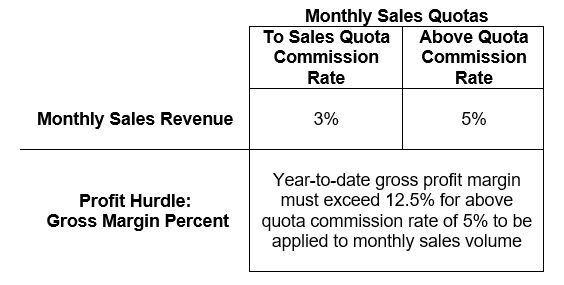
This profit hurdle requires the year-to-date gross margin percent on all revenue to be at or above 12.5% to receive the 5% commission rate on over monthly quota volume. If the year-to-date profit percent remains below 12.5%, the commission rate remains at 3% for over quota sales outcomes for that month, not the higher 5% commission rate.
The advantage to a hurdle/gate formula is success on two measures ensures the highest payout. Instead of gross profit percent, hurdles/gates can also be used for other second measures such as existing account growth, cross-selling and new accounts. The plan is simple to understand and apply. The disadvantage to hurdles/gates is they are binary; either you pass the gate, or you do not. The next two linked approaches solve this shortcoming: multipliers and matrices.
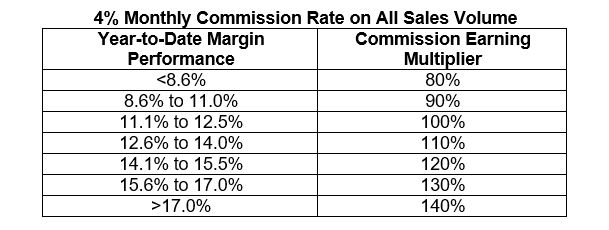
Multipliers. Multipliers provide different levels of elevated or reduced rewards depending on performance of the second measure. In this example, the monthly commission earnings increase or decrease based on year-to-date gross margin performance. In the first formula schedule below, the commission rate is applied to the sales volume for the month. But the monthly payout amount is either increased or decreased depending on the year-to-date profit performance. For example, if the year-to-date percent profit performance is 16%, then the monthly commission earnings are increased by 130% making the monthly payout higher. On the other hand, if the year-to-date profit percent is a low 9%, then the monthly payout is reduced to 90% of the expected commission earnings for the month—a takeaway for year-to-date low gross margin performance.
Another version of a multiplier is to provide different monthly commission rates by profit level. The outcomes are the same as the previous table.
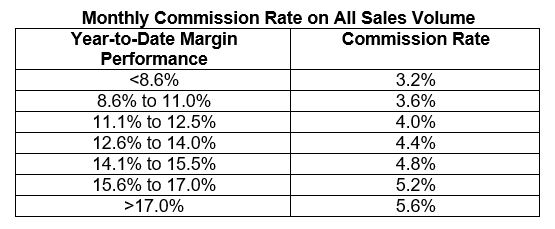
Both multiplier examples provide increasing commission payments as the profit level improves. Both charts provide the same payout; however, the second example does not show the multiplier as a “takeaway,” just different commission rates available for different year-to-date gross profit performance. The first formula schedule imposes a “takeaway,” a compelling rebuke to discounting. The second example does not feature an overt “takeaway.”
The advantages of a multiplier linked design allow for variable commission rates tied to the profit performance. As the profit performance (the second measure) improves, so does the commission payouts for sales volume production. The disadvantage is it requires year-to-date profit calculation accuracy. Tenths of a percent make a significant difference in monthly payouts. Our illustrations use year-to-date profit performance. As an alternative, the formula could use monthly gross profit performance. This would make the monthly payout neutral to year-to-date gross profit performance.
Matrices. Matrices take variable commission rates to the next level. They provide higher pay as performance on two measures improve. Yes, a matrix seems a bit daunting, but sellers quickly understand they need to balance both measures to improve payouts. A correctly designed matrix rewards for exceptional performance on both measures. Success on one measure cannot offset poor performance on the other measure. In the following example, both measures are of equal value, both accounting for 50% of incentive payout. The matrix designer can adjust the matrix to increase the value of one measure greater than the other measure. For example, sales can be weighted 60% and profit weighted 40% in the matrix. Additionally, the “penalty” for poor performance on either measure can be regulated depending on how much the commission declines in the opposing corners: upper left and lower right.
For illustration purposes, we present a 7 by 7 matrix. Normally, these matrices are 9 by 9 or 11 by 11. (Why odd number rows and columns? So, the target commission rate is in the middle cell.)
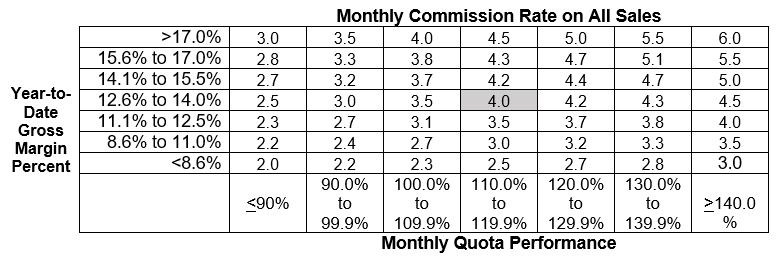
To calculate the monthly commission payout, identify the year-to-date gross margin percent and identify the monthly sales volume quota performance. The intersect provides the commission rate applied to actual sales for the month.
The advantages of a matrix provide a full palette of commission rates, thus payouts. A matrix is ideally suited to say to the salesperson, “Balance your revenue and profit performance to secure the highest commission rate for the month.” Again, the year-to-date margin percent could be replaced with monthly gross profit. Likewise, the monthly quota could be replaced with year-to-date quota performance. Year-to-date measures ensure a long-view accountability of total performance, whereas monthly measures reward short-term results.
The challenge of using a matrix is to ensure cost modeling can project all possible payout scenarios. And, yes, viewing a matrix for the first time can be daunting.

Carefully?
We suggested at the start of this article to consider linked designs carefully. Why? They can be confusing, hard to model and challenging to communicate. However, they offer a superior approach to standalone component measures. If you need to balance two measures in the incentive plan, consider using a linked design: hurdles/gates, multipliers and matrices. For more information, contact us today!